Tales from a Core File

Search
Close this search box.

Category: DTrace

Last Monday was the illumos hack-a-thon. There, I worked with Matt Amdur on adding tab completion support to mdb — the illumos modular debugger. The hack-a-thon was wildly successful and a lot of fun, I hope to put together an entry on the hack-a-thon and give an overview of the projects that were worked on over the course of the next few days. During the hack-a-thon, Matt and I created a working prototype that would complete the types and members using ::print, but there was still some good work for us to do. One of the challenges that we were facing was some unexpected behavior whenever the mdb pager was invoked. We were seeing different actions depending on which actions you took from the pager: continue, quit, or abort.

If you take a look at the source code, you’ll see that sometimes we’ll leave this function by calling longjmp(3c). There’s a lot of different places that we call setjmp(3c) and sigsetjmp(3c) in mdb, so tracking down where we were going just based on looking at the source code would be tricky. So, we want to answer the question, where are we jumping to? There are a few different ways we can do this (and more that aren’t listed):

  1. Inspect the source code
  2. Use mdb to debug mdb
  3. Use the DTrace pid provider and trace a certain number of instructions before we assume we’ve gotten there
  4. Use the DTrace pid provider and look at the jmp_buf to get the address of where we were jumping

Ultimately, I decided to go with option four, knowing that I would have to solve this problem again at some point in the future. The first step is to look at the definition of the jmp_buf definition. For the full definition take a look at setjmp_iso.h. Here’s the snippet that actually defines the type:

     82 #if defined(__i386) || defined(__amd64) || \
     83 	defined(__sparc) || defined(__sparcv9)
     84 #if defined(_LP64) || defined(_I32LPx)
     85 typedef long	jmp_buf[_JBLEN];
     86 #else
     87 typedef int	jmp_buf[_JBLEN];
     88 #endif
     89 #else
     90 #error "ISA not supported"
     91 #endif

Basically, the jmp_buf is just an array where we store some of registers. Unfortunately this isn’t sufficient to figure out where to go. So instead, we need to take a look at the implementation. setjmp is implemented in assembly for the particular architecture. Here it is for x86 and amd64. Now that we have the implementation, let’s figure out what to do. As a heads up, if you’re looking at any of these .s files, the numbers are actually in base 10, which is different from what you get when you look at the mdb output which has them in hex. Let’s take a quick look at the longjmp source for a 32-bit system and dig into what’s going on and how we know what to do:

     73 	ENTRY(longjmp)
     74 	movl	4(%esp),%edx	/ first parameter after return addr
     75 	movl	8(%esp),%eax	/ second parameter
     76 	movl	0(%edx),%ebx	/ restore ebx
     77 	movl	4(%edx),%esi	/ restore esi
     78 	movl	8(%edx),%edi	/ restore edi
     79 	movl	12(%edx),%ebp	/ restore caller's ebp
     80 	movl	16(%edx),%esp	/ restore caller's esp
     81
     82 	movl	24(%edx), %ecx
     83 	test	%ecx, %ecx	/ test flag word
     84 	jz	1f
     85 	xorl	%ecx, %ecx	/ if set, clear ul_siglink
     86 	movl	%ecx, %gs:UL_SIGLINK
     87 1:
     88 	test	%eax,%eax	/ if val != 0
     89 	jnz	1f		/ 	return val
     90 	incl	%eax		/ else return 1
     91 1:
     92 	jmp	*20(%edx)	/ return to caller
     93 	SET_SIZE(longjmp)

The function is pretty well commented, so we can follow along pretty easily. Basically we load the jmp_buf that was passed in into %edx, add 0x14 to that value and then jump to that piece of code. So now we know exactly what the address we’re returning to is. With this in hand, we only have two tasks left: transforming this address into a function and offset, and doing this all with a simple DTrace script. Solving the first problem is actually pretty easy. We can just use the DTrace uaddr function which will translate it into an address and offset for us. The script itself is now an exercise in copyin and arithmetic. Here’s the main part of the script:

/*
 * Given a sigbuf translate that into where the longjmp is taking us.
 *
 * On i386 the address is 0x14 into the jmp_buf.
 * On amd64 the address is 0x38 into the jmp_buf.
 */

pid$1::longjmp:entry
{
        uaddr(curpsinfo->pr_dmodel == PR_MODEL_ILP32 ?
            *(uint32_t *)copyin(arg0 + 0x14, sizeof (uint32_t)) :
            *(uint64_t *)copyin(arg0 + 0x38, sizeof (uint64_t)));
}

Now, if we run this, here’s what we get:

[root@bh1-build2 (bh1) /var/tmp]# dtrace -s longjmp.d $(pgrep -z rm mdb)
dtrace: script 'longjmp.d' matched 1 probe
CPU     ID                    FUNCTION:NAME
  8  69580                    longjmp:entry   mdb`mdb_run+0x38

Now we know exactly where we ended up after the longjmp(), and this will method will work on both 32-bit and 64-bit x86 systems. If you’d like to download the script, you can just download it from here.

Last March, Bryan Cantrill and I joined Max Bruning on working towards bringing KVM to illumos. Six months ago we found ourselves looping in x86 real mode and today we’re booting everything from Linux to Plan 9 to Weenix! For a bit more background on how we got there take a gander at Bryan’s entry on KVM on illumos.

For the rest of this entry I’m going to talk about the exciting new analytics we get by integrating DTrace and kstats into KVM. We’ve only scratched the surface of what we can see, but already we’ve integrated several metrics into Cloud Analytics and have gained insight into different areas of guest behavior that the guests themselves haven’t really seen before. While we can never gain the same amount of insight into Virtual Machines (VMs) that we can with a zone, we easily have insight into three main resources of a VM: CPU, disk, and network. Cloud Operators can use these metrics to determine if there is a problem with a VM, determine which VMs are having issues, and what areas of the system are suffering. In addition, we’ve pushed the boundaries of observability by taking advantage of the fact that several components of the hardware stack are virtualized. All in all, we’ve added metrics in the following areas:

  • Virtual NIC Throughput
  • Virtual Disk IOps
  • Virutal Disk Throughput
  • Hardware Interrupts
  • Virtual Machine Exits
  • vCPU Samples

NICs and Disks

One of the things that we had to determine early on was how the guests virtual devices would interface with the host. For NICs, this was simple: rather than trying to map a guest’s NIC to a host’s TUN or TAP device; we just used a VNIC, which was introduced into the OS by the Crossbow project. Each guest NIC corresponds directly to a Crossbow VNIC. This allows us to leverage all of the benefits of using a VNIC including anti-spoof and the analytics that already exist. This lets us see the throughput in terms of either bytes or packets that the guest is sending and receiving on a per guest NIC basis.

The story with disks is quite similar. In this case each disk that the guest sees is backed by a zvol from ZFS. This means that guests unknowingly get the benefits of ZFS: data checksums, snapshots and clones, the ease of transfer via zfs send and zfs receive, redundant pooled storage, and a proven reliability. What is more powerful here is the insight that we can provide into the disk operations. We provide two different views of disk activity. The first is based on throughput and the second is based on I/O operations.

The throughput based analytics are a great way to understand the actual disk activity that the VM is doing. Yet the operations view gives us several interesting avenues to drill down into VM activity. The main decompositions are operation type, latency, offset, and size. This gives us insight into how guest filesystems are actually sending activity to disk. As an example, we generated the following screenshot from a guest running Ubuntu on an ext3 filesystem. The guest would loop creating a 3gb file, sleeping for a seconds, reading the file, and deleting the file before beginning again. In the image below we see operations decomposed by operation type and offset. This allows us to see where on disk ext3 is choosing to lay out blocks on the filesystem. The x-axis represents time; each unit is one second. The y-axis shows the virtual disk block number.

ext3 offsets

Hardware Interrupts

Brendan Gregg has been helping us out by diligently measuring our performance, comparing us to both a bare metal Linux system and KVM under Linux. While trying to understand the performance characteristics and ensuring that KVM on illumos didn’t have too many performance pathologies he stumbled across an interesting function in the kvm source code: vmx_inject_irq. This function is called any time a hardware interrupt is injected into the guest. We combined this information with an incredibly valuable idea for heatmaps that Brendan thought up. A heatmap based upon subsecond offset allows us to see when across a given second some action occurred. The x-axis is the same as the previous graph, one second. The y-axis though represents when in the second this item occurred, i.e. where in the 1,000,000 microseconds did this action occur. Take a look at the following image:

subsecond offset by irqs

Here we are visualizing which interrupts occurred in a given second and looking at it based upon when in the second they occur. Each interrupt vector is colored differently. The red represents interrupts caused by the disk controller and yellow by the network controller. The blue is the most interesting: these are timer based interrupts generated by the APIC. Lines that are constant across the horizontal means that these are events that are happening at the same time every second. These represent actions caused by an interval timer, something that
always fires every second. However there are lines that look like a miniature stair; ones that go up at an angle. These represent an application that does work, calls sleep(3C) for an interval, does a little bit of work and sleeps again.

VM Exits

A VM exits when the processor ceases running the guest code and returns to the host kernel to handle something which must be emulated such as memory mapped I/O or accessing one of the emulated devices. One of the ways to increase VM performance is to minimize the number of exits. Early on during our work porting KVM we saw that there were various statistics that were being gathered and exported via debugfs in the Linux KVM code. Here we leveraged kstats and Bryan quickly wrote up kvmstat. kvmstat quickly became an incredibly useful tool for us to easily understand VM behavior. What we’ve done is leverage the kstats which allow us to know which VM, which vCPU, and which of a multitude of reasons the guest exited and add that insight into Cloud Analytics.

vCPU Samples

While working on KVM and reading through the Intel Architecture Manuals I reminded myself of a portion of x86 architecture that is quite important, mainly that the root of the page table is always going to be stored in cr3. Unique values in cr3 represent unique Memory Management Unit (MMU) contexts. Most modern operating systems that run on x86 use a different a different MMU context for each process running on the system and the kernel. Thus if we look at the value of cr3 we get an opaque token that represents something running in the guest.

Brendan had recently been adding metrics to Cloud Analytics based upon using DTrace’s profile provider and combining the gathered data with the subsecond offset heatmaps that we previously discussed. Bryan had added a new variable to D that allowed us to look at the register state of a given running vCPU. To get the value of cr3 that we wanted we could use something along the lines of vmregs[VMX_GUEST_CR3]. When you combine these two we get a heatmap that shows us what is running in the guest. Check out the image below:

vCPU samples by cr3 and subsecond offset

Here, we’ve sampled at a frequency of 99 Hz. We avoid sampling at 100 Hz because that would catch a lot of periodic system activity. We’re looking at a one CPU guest running Ubuntu. The guest is initially idle. Next we start two CPU bound activities, highlighted in blue and yellow. What we can visualize are the scheduling decisions being made by the Linux kernel. To further see what happened, we used renice on one of the processes setting it to a value of 19. You can see the effect in the first image below as the blue process rarely runs in comparison to the yellow. In the second image we experimented with the effects of setting different nice values.

vCPU samples by cr3 and subsecond offset

vCPU samples by cr3 and subsecond offset

These visualizations are quite useful. They let us give someone an idea of what is running in their VM. While it can’t pinpoint it to the exact process, it does let the user understand what the characteristics of their workload are and whether it is a few long lived processes fighting for the CPU, lots of short lived processes coming and going, or something in between. Like the rest of these metrics this lets you understand where in your fleet of VMs the problem may be occurring and help narrow things down to which few VMs should be looked at with native tools.

Conclusion

We’ve only begun to scratch the surface of what we can understand about a virtual machine running under KVM on illumos. Needless to say, this wouldn’t be possible without DTrace and its guarantees of safety for use on production systems and only the overhead of a few NOPs when not in use. As time goes on we’ll be experimenting on what information can help us, operators, and end users better understand their VM’s performance and adding those abilities to Cloud Analytics.

As a part of the work for Cloud Analytics that Dave, Bryan, Brendan, and I been doing, we’ve added several USDT probes to Node. As I’ve been doing a lot of the integration work and working with Ryan Dahl to get them into Node itself, I thought that I would document what we’ve added and talk a bit about what information we can get from the probes. Dave has a blog entry that explains how you can use these probes and Cloud Analytics to understand what’s going on with your application.

Currently Node has probes that let us track the following events:

Before we jump too far ahead of ourselves, we should talk a bit about how to enable DTrace USDT probes with node. To get the DTrace probes in node, you can pass the option –with-dtrace to configure. This flag will fail on systems that aren’t SunOS (i.e. Illumos and OpenSolaris). Now, OS X and FreeBSD do have DTrace. You can certainly hack the wscript for node to get the probes compiled into OS X and FreeBSD; however, they have not been tested. On OS X you can get the probes to fire; however, the translator does not currently work on OS X, which limits their power. I have not tested this on FreeBSD 9 which added support for the USDT provider. So, let’s build node with support for DTrace!

$ ./configure --with-dtrace && make && make install

So, now we can go ahead and list all of the probes that DTrace has for node. To do this we need to fire up our newly compiled node and then run the following DTrace command to see all the probes that we have:

rm@devel ~ $ dtrace -l -n node*:::
   ID   PROVIDER            MODULE                          FUNCTION NAME
 4331  node12090              node _ZN4node14dtrace_gc_doneEN2v86GCTypeENS0_15GCCallbackFlagsE gc-done
 4332  node12090              node _ZN4node15dtrace_gc_startEN2v86GCTypeENS0_15GCCallbackFlagsE gc-start
 4333  node12090              node _ZN4node26DTRACE_HTTP_CLIENT_REQUESTERKN2v89ArgumentsE http-client-request
 4334  node12090              node _ZN4node27DTRACE_HTTP_CLIENT_RESPONSEERKN2v89ArgumentsE http-client-response
 4335  node12090              node _ZN4node26DTRACE_HTTP_SERVER_REQUESTERKN2v89ArgumentsE http-server-request
 4336  node12090              node _ZN4node27DTRACE_HTTP_SERVER_RESPONSEERKN2v89ArgumentsE http-server-response
 4337  node12090              node _ZN4node28DTRACE_NET_SERVER_CONNECTIONERKN2v89ArgumentsE net-server-connection
 4338  node12090              node _ZN4node22DTRACE_NET_SOCKET_READERKN2v89ArgumentsE net-socket-read
 4339  node12090              node _ZN4node23DTRACE_NET_SOCKET_WRITEERKN2v89ArgumentsE net-socket-write
 4340  node12090              node _ZN4node21DTRACE_NET_STREAM_ENDERKN2v89ArgumentsE net-stream-end

As we can see there are several probes here, for this entry we’re going to leave out net-stream-end and net-server-connection. If we include the path to the node.d file, we can even view all the arguments of the probe. The node.d file is a translator that is installed into $PREFIX/lib/dtrace. As long as you have the libdir patch (or move the file into /usr/lib/dtrace) then you should be all set and we can run:

rm@devel ~ $ dtrace -L $PREFIX/lib/dtrace -v -n node*:::
   ID   PROVIDER            MODULE                          FUNCTION NAME
 4331  node12090              node _ZN4node14dtrace_gc_doneEN2v86GCTypeENS0_15GCCallbackFlagsE gc-done

        Probe Description Attributes
                Identifier Names: Private
                Data Semantics:   Private
                Dependency Class: Unknown

        Argument Attributes
                Identifier Names: Evolving
                Data Semantics:   Evolving
                Dependency Class: ISA

        Argument Types
                args[0]: int
                args[1]: int

 4332  node12090              node _ZN4node15dtrace_gc_startEN2v86GCTypeENS0_15GCCallbackFlagsE gc-start

        Probe Description Attributes
                Identifier Names: Private
                Data Semantics:   Private
                Dependency Class: Unknown

        Argument Attributes
                Identifier Names: Evolving
                Data Semantics:   Evolving
                Dependency Class: ISA

        Argument Types
                args[0]: int
                args[1]: int

 4333  node12090              node _ZN4node26DTRACE_HTTP_CLIENT_REQUESTERKN2v89ArgumentsE http-client-request

        Probe Description Attributes
                Identifier Names: Private
                Data Semantics:   Private
                Dependency Class: Unknown

        Argument Attributes
                Identifier Names: Evolving
                Data Semantics:   Evolving
                Dependency Class: ISA

        Argument Types
                args[0]: node_http_request_t *
                args[1]: node_connection_t *
 4334  node12090              node _ZN4node27DTRACE_HTTP_CLIENT_RESPONSEERKN2v89ArgumentsE http-client-response

        Probe Description Attributes
                Identifier Names: Private
                Data Semantics:   Private
                Dependency Class: Unknown

        Argument Attributes
                Identifier Names: Evolving
                Data Semantics:   Evolving
                Dependency Class: ISA

        Argument Types
                args[0]: node_connection_t *

 4335  node12090              node _ZN4node26DTRACE_HTTP_SERVER_REQUESTERKN2v89ArgumentsE http-server-request

        Probe Description Attributes
                Identifier Names: Private
                Data Semantics:   Private
                Dependency Class: Unknown

        Argument Attributes
                Identifier Names: Evolving
                Data Semantics:   Evolving
                Dependency Class: ISA

        Argument Types
                args[0]: node_http_request_t *
                args[1]: node_connection_t *

 4336  node12090              node _ZN4node27DTRACE_HTTP_SERVER_RESPONSEERKN2v89ArgumentsE http-server-response

        Probe Description Attributes
                Identifier Names: Private
                Data Semantics:   Private
                Dependency Class: Unknown

        Argument Attributes
                Identifier Names: Evolving
                Data Semantics:   Evolving
                Dependency Class: ISA

        Argument Types
                args[0]: node_connection_t *

 4338  node12090              node _ZN4node22DTRACE_NET_SOCKET_READERKN2v89ArgumentsE net-socket-read

        Probe Description Attributes
                Identifier Names: Private
                Data Semantics:   Private
                Dependency Class: Unknown

        Argument Attributes
                Identifier Names: Evolving
                Data Semantics:   Evolving
                Dependency Class: ISA

        Argument Types
                args[0]: node_connection_t *
                args[1]: int

 4339  node12090              node _ZN4node23DTRACE_NET_SOCKET_WRITEERKN2v89ArgumentsE net-socket-write

        Probe Description Attributes
                Identifier Names: Private
                Data Semantics:   Private
                Dependency Class: Unknown

        Argument Attributes
                Identifier Names: Evolving
                Data Semantics:   Evolving
                Dependency Class: ISA

        Argument Types
                args[0]: node_connection_t *
                args[1]: int


For the rest of this entry we’ll go over the different probes and their arguments. I’ll detail what they are and how you can get some useful information from them. In a future entry I’ll discuss how you can use this information.

HTTP Server Probes

When an HTTP request comes in it will fire the http-server-request probe. The probe is fired once node receives all of the HTTP headers for the incoming connection. Thus the probe fires right before the HTTP socket emits the event ‘request’. The http-server-request probe has two arguments. The first argument tells us information about the HTTP request. We can use it to get the method and url requested. The second argument tells us information about who is connecting to our HTTP server. We can view all this information with the following DTrace snippet:

# cat -n /tmp/node-httpd-request.d
     1  #pragma D option quiet
     2
     3  node21291:::http-server-request
     4  {
     5          printf("Connection from %s:%d on fd %d - Request %s: %s\n",
     6              args[1]->remoteAddress, args[1]->remotePort, args[1]->fd,
     7              args[0]->method, args[0]->url);
     8  }
# dtrace -L$PREFIX/lib/dtrace -s node-httpd-request.d
Connection from 10.99.99.254:63486 on fd 7 - Request GET: /
Connection from 10.99.99.254:63487 on fd 7 - Request GET: /
Connection from 10.99.99.254:63488 on fd 7 - Request GET: /
Connection from 10.99.99.254:63489 on fd 7 - Request GET: /
Connection from 10.99.99.254:63490 on fd 7 - Request GET: /
^C

The corresponding probe, http-server-response, will fire once we have finished sending all the data in our response to the client. This probe no longer has the information on the incoming HTTP request, but does have all of the information about who we are talking to. Here’s all the information that we have:

# cat node-http-response.d
     1  #pragma D option quiet
     2
     3  node*:::http-server-response
     4  {
     5          printf("Connection from %s:%d on fd %d\n",
     6              args[0]->remoteAddress, args[0]->remotePort, args[0]->fd);
     7  }
# dtrace -L$PREFIX/lib/dtrace -s node-http-response.d
Connection from 127.0.0.1:59149 on fd 8
Connection from 127.0.0.1:39130 on fd 9
Connection from 10.99.99.254:63691 on fd 7
Connection from 10.99.99.254:55004 on fd 19
Connection from 10.99.99.254:55000 on fd 14
Connection from 10.99.99.254:55276 on fd 16
Connection from 10.99.99.254:54977 on fd 11

Now, if we want to track the time that has elapsed, we have to be a little smarter. In node we could have multiple connections going on at the same time, and these are all going to occur in the same thread. This means that we cannot use the traditional thread-local variables that we might do via self->foo. So, how do we actually correlate one http-server-request probe with its http-server-response probe? Each connection is using a separate socket and each socket has its own file descriptor. There is a one to one correlation between sockets and file descriptors. A file descriptor will only be reused if the socket it was previously associated with was closed. So if we wanted to track the latency we can use the file descriptor to correlate events and write a small script that looks something like:

rm@devel ~ $ cat  -n/tmp/httpd-lat.d
     1  #pragma D option quiet
     2
     3  node*:::http-server-request
     4  {
     5          latency[args[1]->fd] = timestamp;
     6  }
     7
     8  node*:::http-server-response
     9  {
    10          printf("Request took %d nanoseconds to complete\n",
    11              timestamp - latency[args[0]->fd]);
    12  }
rm@devel ~ $ dtrace -L$PREFIX/lib/dtrace -s /tmp/httpd-lat.d
Request took 444589 nanoseconds to complete
Request took 939339 nanoseconds to complete
Request took 353588 nanoseconds to complete
Request took 1431926 nanoseconds to complete
Request took 334404 nanoseconds to complete
^C

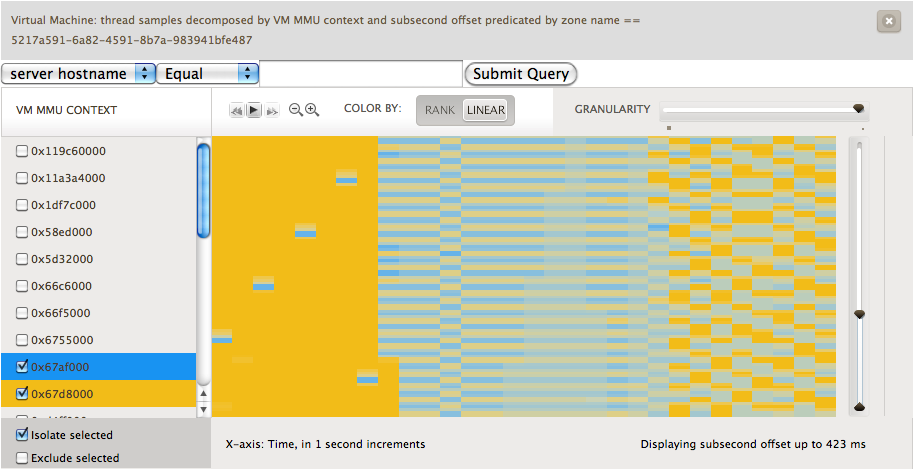
Now, if we run this with the sample Node ‘Hello, world!’ HTTP server we certainly can get some rather interesting data. But the value comes from being able to visualize this data, something that Brendan has looked at extensively.

HTTP Client Probes

The HTTP Client probes have been designed to correspond to their HTTP Server counterparts. There are both http-client-request and http-client-response probes. The http-client-request gets fired when an outgoing request is made and the http-client response probe is fired when we have received the response. In terms of arguments, the HTTP Client probes work identically to their server counterparts. The http-client-request has information about what the underlying connection and the HTTP resource we have asked for. The http-client-response probe only has information on the underlying socket.

Let’s look at the same information as we did with the HTTP Server probes, but this time with the client:

# cat -n /tmp/node-httpc-request.d
     1  #pragma D option quiet
     2
     3  node*:::http-client-request
     4  {
     5          printf("Connection to %s:%d on fd %d - Request %s: %s\n",
     6              args[1]->remoteAddress, args[1]->remotePort, args[1]->fd,
     7              args[0]->method, args[0]->url);
     8  }
# dtrace -L$PREFIX/lib/dtrace -s /tmp/node-httpc-request.d
Connection to 127.0.0.1:23184 on fd 10 - Request GET: /ca/instrumentations/1/value/raw?start_time=1298733995
Connection to 127.0.0.1:23185 on fd 12 - Request GET: /ca/instrumentations/4/value/raw?start_time=1298733995
Connection to 127.0.0.1:23184 on fd 10 - Request GET: /ca/instrumentations/1/value/raw?start_time=1298733997
Connection to 127.0.0.1:23184 on fd 13 - Request GET: /ca/instrumentations/5/value/raw?start_time=1298733997
Connection to 127.0.0.1:23185 on fd 12 - Request GET: /ca/instrumentations/4/value/raw?start_time=1298733997
^C

Again, we can do a similar thing for the response:

# cat -n /tmp/node-httpc-response.d
     1  #pragma D option quiet
     2
     3  node*:::http-client-response
     4  {
     5          printf("Connection to %s:%d on fd %d\n",
     6              args[0]->remoteAddress, args[0]->remotePort, args[0]->fd);
     7  }
# dtrace -L$PREFIX/lib/dtrace -s /tmp/node-httpc-response.d
Connection to 127.0.0.1:23185 on fd 15
Connection to 127.0.0.1:23185 on fd 13
Connection to 127.0.0.1:23184 on fd 18
Connection to 127.0.0.1:23184 on fd 12
Connection to 127.0.0.1:23184 on fd 10
^C

With all of this information we can gather a lot of useful information. Because both probes have the file descriptor, we can link them together to get the latency, as we did previously. Because a node program may be making several HTTP requests to external services, having the ability to know which request is inducing how much latency is quite valuable.

Socket Read/Write Probes

This next set of probes is in fact two different probes, one which fires on every read from a socket and one that fires on every write to a socket. In addition to the information about the socket itself, we get two very useful numbers: the size of the data and the amount buffered. Whenever node does a write to a socket, it attempts to write all of it to the kernel at once. However, if the write would block, node stores the data in userland and will write it out a bit later. When this happens, the call to write returns false. If you aren’t careful or checking the return value from write that buffer can grow quite quickly in userland and eat up a lot of memory. Let’s look at how we can use these two probes:

# cat -n socket.d
     1  #pragma D option quiet
     2
     3  node*:::net-socket-read,
     4  node*:::net-socket-write
     5  {
     6          printf("%s:%d -- %d bytes -- %d buffered\n", args[0]->remoteAddress,
     7              args[0]->remotePort, arg1, args[0]->bufferSize);
     8  }
# dtrace -L$PREFIX/lib/dtrace -s /tmp/socket.d
10.99.99.254:55000 -- 314 bytes -- 0 buffered
10.99.99.254:55000 -- 2740 bytes -- 0 buffered
10.99.99.254:55000 -- 2 bytes -- 0 buffered
10.99.99.254:55000 -- 5 bytes -- 0 buffered
^C

Garbage Collection Probes

Javascript is a language where you don’t have to explicitly manage memory like you do in C. Instead, the runtime uses various techniques to allocate and later determine what memory can be freed. This technique is known as garbage collection. Node is using v8 under the hood to do this work. v8 gives us the ability to be notified right before garbage collection starts and ends. We have two pieces of information from the garbage collection process: the type of garbage collection and various flags.

To understand the different types, we have to dive into the v8 header file. Node v0.4.0 is currently using v8 version v3.1. If we open up /usr/include/v8.h we see the following for valid garbage collection types:

2472 enum GCType {
2473   kGCTypeScavenge = 1 << 0,
2474   kGCTypeMarkSweepCompact = 1 << 1,
2475   kGCTypeAll = kGCTypeScavenge | kGCTypeMarkSweepCompact
2476 };

From this we can see that v8 supports two different kinds of garbage collection. To help understand the differences, it's important to know that v8 uses the notion of generations. Generational garbage collection makes the observation that objects fall into two camps: those that come and go rather quickly and those that stick around for a while. Mark and Sweep compaction is a traditional form of garbage collection which works well for older objects, but takes much longer. The Scavenge algorithm works well for short lived objects and is generally much quicker than Mark and Sweep. Dave helps explain why we care about GC.

The other argument to our GC probes are a series of flags. Currently this looks like:

2478 enum GCCallbackFlags {
2479   kNoGCCallbackFlags = 0,
2480   kGCCallbackFlagCompacted = 1 << 0
2481 };

When using the probes, there are a few useful things to know. When GC occurs, nothing else is going to run. Furthermore, v8 uses the same thread to call the GC prologue and epilogue handlers. These callbacks are respectively fired immediately before and immediately after the GC operation. Because we have the same thread calling it, we can use a thread local variable in D to keep track of and answer the question of how much latency was due to garbage collection. We can do this with the following D script:

# cat -n /tmp/node-gc.d
     1  #pragma D option quiet
     2
     3  node*:::gc-start
     4  {
     5          self->ts = timestamp;
     6  }
     7
     8  node*:::gc-done
     9  {
    10          printf("Spent %d nanoseconds doing Garbage Collection\n",
    11              timestamp - self->ts);
    12          self->ts = 0
    13  }
# dtrace -s /tmp/node-gc.d
Spent 780604 nanoseconds doing Garbage Collection
Spent 50416942 nanoseconds doing Garbage Collection
Spent 33276517 nanoseconds doing Garbage Collection
Spent 14498463 nanoseconds doing Garbage Collection
Spent 3847561 nanoseconds doing Garbage Collection
^C

Those are all the probes that we have currently added to node. All of them are available in the stock node src that you can download and compile yourself. The idea behind all of the probes that we added is to be able to answer a question directly related to what your application is doing and to be able to understand why and where issues are coming from.

As a part of the work Bryan, Dave, Brendan, and I have been doing to instrument Node, Bryan wrote a translator file. One of the nice things about DTrace is that you can define the arguments to a probe to be a structure and simply access them like a C struct. The way that this all works is via a translator for USDT probes which embeds knowledge of how to look up members of a probes struct. Unfortunately, there is currently a bug in how we handle dependencies for translators, but we also have a fix for that problem. But before I get there, let’s show an example of he use of translators. Let’s say that I want to get the method for every HTTP request that is coming in with node. I can use the following DTrace snippet:

# dtrace -n 'node*:::http-server-request{ printf("%s", args[0]->method); }'
dtrace: description 'node*:::http-server-request' matched 6 probes
CPU ID FUNCTION:NAME
0 3705 _ZN4node26DTRACE_HTTP_SERVER_REQUESTERKN2v89ArgumentsE:http-server-request GET

The DTrace probes themselves specify a specific argument type. If that translator argument is a struct, we can define an operation to transform the probe argument and get out a specific value. Generally this involves a lot of use of copyin and copyinstr and is quite messy o write, but once written makes all scripts that leverage it much more powerful. These translators is that you can express the dependencies between them. In this case, the Node translator relies on the procfs translator. Thus for this to work, you need to have procfs.d which ships with SunOS.

Now, the big question to ask is how does DTrace know where to look for these translators. By default DTrace looks in /usr/lib/dtrace. However, you can also tell DTrace to look in an additional location by using the -Lpath flag to dtrace(1M). So if you wanted to keep your node.d provider in say /opt/rm/lib/dtrace, we could run the above command as:

# dtrace -L/opt/rm/lib/dtrace -n 'node*:::http-server-request{ printf("%s", args[0]->method); }'

Now, unfortunately there is a bug in this; however, I have a fix for it. Without this fix when trying to resolve library dependencies, DTrace only looks for the file in the same directory. So it would try and look for the dependency procfs.d in /opt/rm/lib/dtrace/procfs.d. However, we don’t have it there, we have it in /usr/lib/dtrace.

Here is a patch against Illumos that fixes this issue. Please note that the patch there is released under the CDDL and copyrighted by Joyent. It causes us to search our entire library path to try and find the first occurrence of a file with the name we’re looking for. So in our case above, we will find that proc.d is in /usr/lib/dtrace and resolve the dependency correctly. Hopefully we’ll see this fix make it upstream into Illumos before too long, as well as, Mac OS X and FreeBSD.

A while back I was feeling like experimenting with a BSD just for a change of pace. My first inclination was to take a look at FreeBSD because of the ZFS and DTrace support that it has. I had heard the news that Debian/kFreeBSD was going to be considered stable and get the same treatment for security as the traditional GNU/Linux Debian Distributions. One of the things I’ve always liked about Debian is that they do try and stay active with security with their stable releases, which is what you want when you have a machine that is going to be out there braving everything the Internet might throw at it. So I decided to give it a whirl and investigate its current state. While the main installer doesn’t have ZFS support, the Debian Developer Robert Millan put together an installer with ZFS support.

So I booted up and went through the installer. One currently known limitation ofthe installer is that you can’t create a ZFS mirror. Though you can simply ZFS attach a disk later to create a mirror. Though, be careful, some versions of GRUB2 which Debian/kFreeBSD is using don’t handle mirrors well. From here, I wanted to get the familiar help message that comes from running dtrace with no arguments. You can imagine my surprise when I ran:

~ $ dtrace
-bash: dtrace: command not found

Well that’s no good. A quick scour of the package list confirmed my suspicions that there was no DTrace package. While obviously people end up thinking about something like ZFS much more than they might DTrace, after you get used to using DTrace it isn’t something you want to give up.

So, I began to take a look at what it might take to get DTrace working on the system. There are two major hurdles. The first comes in the form of making sure that the kernel components are in place. The second part is getting all the userland pieces in place: libdtrace, dtrace(1), etc. Now the first part is substantially easier than the second. One of the decisions that Debian/kFreeBSD
made was switching from the libc to glibc, as well as some other changes to make things fit more inside the Debian system.

The first step was to see if we had the kernel module and maybe it wasn’t loaded. To deal with this I ran:

# kldload dtrace

Syslog had some nasty messages waiting for me:
link_elf_obj: symbol lapic_cyclic_clock_func undefined
linker_load_File: Unsupported file type
KLD dtrace.ko: depends on cyclic – not available or version mismatch
linker_load_File: Unsuportted file type

Well, time to go try and take a look at rebuilding the kernel and get the cyclic module in there. To get started, you’re going to have to get several packages for building the kernel. This should be most of the ones that you need from a fresh install, though some may be missing: dpkg-dev debhelper quilt sharutils flex gcc-4.3 libdb-dev libbsd-dev libsbuf-dev.

The next thing you need to do is setup the appropriate environment. The FreeBSD build utils are all prefixed, but the kernel compilations call the traditional make, lex, yacc, etc. which calls the GNU counterparts. As you could imagine this causes some issues. The trick is to appropriately alias, symlink, or use whatever method you prefer to make it so all of the commands that start with freebsd no longer have that, i.e. freebsd-make will be the make you call.

Now we need to get the source to actually work with. So find a directory that you want to work in and run the following:

# apt-get source kfreebsd-source-8.1

This gets us the source of the package so we can eventaully build a new kernel and install it in the proper Debian fashion. From here you need to cd into kfreebsd-8-8.1/debian/arch/amd64/. Note the directory may not be kfreebsd-8-8.1 and may be a slightly different version number depending on when you go about this. Fire up vim (or your other text editor of choice) and edit the file amd64.config.

Add the following lines:

  • option DDB_CTF
  • – makeoptions WITH_CTF=1
  • – option KDTRACE_HOOKS
  • – option KDTRACE_FRAME (Only necessary for amd64 based kernels)

Now that we’re all set with this, time to let rip! From the root of the package, i.e. kfreebsd-8-8.1 in this case, run the following:

# dpkg-buildpackage -B -uc

This may say you don’t have a needed dependency, if that happens install it. If it does, then just go for it and let rip. Once this is done, you should see a lot of packages one directory level up. From here, install the image. Once that is all set, time to reboot and switch kernels.

Now that we have rebuilt and installed our kernel, we can go ahead and verify that we actually managed to do things correctly. The first trick is to go ahead and again run:

# kldload cyclic
# kldload dtrace

This should work without any scary error messages on dmesg, if it didn’t, you’ll want to confirm you booted into the right kernel and do all those fun things.

We have a kernel module, where next?

Well there are still two major things to get working. The first and more important is that we need the userland pieces for DTrace to work. Unfortunately the transition between the BSD libc and glibc is not a painless one and may be something I take a look at again at a later date. The second piece of the puzzle is to get CTF data in place. Unfortunately this requires that we have the ctfconvert and ctfmerge tools, which are not part of the stock Debian install. These will get built as a part of getting all the userland DTrace tools in place.

Recent Posts

September 27, 2019
September 6, 2019
October 1, 2014

Archives