Tales from a Core File

Search
Close this search box.

We at Joyent use DTrace for understanding and debugging userland applications just as often as we do for the kernel. That is part of the reason why we’ve worked on things like flamegraphs, the Node.js ustack helper, and the integration of libusdt in node module’s like restify and bunyan.

I’ve just put back some work that makes observing userland with DTrace a lot simpler and much more powerful. Before we meet the devil in the details, let’s start with an example:

$ cat startd.d
pid$target::start_instance:entry,
pid$target::stop_instance:entry
{
        printf("%s: %s\n", probefunc == "start_instance" ?
            "starting" : "stopping", stringof(args[1]->ri_i.i_fmri));
}
$ dtrace -qs startd.d -p $(pgrep -o startd)
...
stopping: svc:/system/intrd:default
stopping: svc:/system/cron:default
start_instance:entry starting: svc:/system/cron:default
...

If you’re familiar with DTrace you might realize that this doesn’t really look like what you’re expecting! Hey Robert, won’t that script blow up without the copyin? Also where did the args[] come from with the pid provider?!

The answer to this minor mystery is that DTrace can now leverage type information in userland programs. Not only does the compiler know the size and layout of types, it’ll also take care of adding calls to copyin for you so you can dereference members without fear. To explain how we’ve managed all of this, we need to go into a bit of back story.

The Compiler is the Enemy

Since the beginning of programming, we’ve needed to be able to debug the programs that we’ve written. A large chunk of time has been spent on tooling to be able to understand and root cause these bugs whether working on a live system or doing a post-mortem analysis on something like a core dump.

Unfortunately, the compiler is in many ways our enemy. Its goal is to take whatever well commented and understandable code we might have and transform it not only into something that a processor can understand, but often times transforming it through optimization passes into something that no longer resembles what we originally wrote.

This problem isn’t limited to languages like C and C++. In fact, many of the same problems apply when you use any compiler, be it your current compile to JavaScript language of the day (emscripten and coffeescript) or something like lex and yacc.

Fortunately, both the compiler and the linker are just software. Shortly after we first hit this problem, they were modified to produce debugging information that could be encoded into the binaries they produced. Folks even were able to encode this kind of information in the original ‘a.out’ executable format that came around in first edition UNIX.

One of the first popular formats that was used was called stabs. It was used on many operating systems for many years and you can still convince compilers like gcc, clang, and suncc to generate it. Since then, DWARF has become the most popular and commonly used format. The initial origin of DWARF came from Bell Labs, but it was rather unpopular because the debugging data that it created was just too large. Since then DWARF has become more standardized and more compact than the first version of DWARF. However, it is a rather complicated format.

With all of these formats there is a trade-off between expressibility and size. If the debugging information takes too much space, then people stop including it. Most available OS and package distributions do not incorporate debugging information. If you’re lucky, they separate that information into different packages. This means that when you’re debugging a problem in production you very often don’t have the very information you need. Even more frustrating, when this information is in a separate file and you’re trying to do post-mortem analysis, then you need to track that down and make sure that you have the right version of the debug information that corresponds to what you were using in production.

This situation is unsatisfying, but – we have other options! Sun developed CTF in Solaris 9 with the intent of using it with mdb and eventually DTrace. In illumos, we put CTF data in every kernel module, library, and a majority of applications. We don’t store all the information that you might get in, say, DWARF, but we store what we’ve found over the years to be the most useful information.

CTF data includes the following pieces of information:

o The definitions of all types and structures
o The arguments and types of each function
o The types of function return values
o The types of global variables

All of the CTF data for a given library, binary, or kernel module is found inside of what we call a CTF Container. The CTF container is found as its own section in an ELF object. A simple way to see if something in question has CTF is to run elfdump(1). Here’s an example:

$ elfdump /lib/libc.so | grep SUNW_ctf
Section Header[37]:  sh_name: .SUNW_ctf

If a library or program does not have CTF data then the section won’t show up in the list and the grep should turn up empty.

CTF and DTrace

If you’ve ever wondered how it is that DTrace knows types when you use various providers, like args[] in fbt, the answer to that is CTF. When you run DTrace, it loads relevant CTF containers for the kernel. In fact, even the basic types that D provides, such as an int or types that you define in a D script, end up in a CTF container. Consider the following dtrace invocation:

# dtrace -l -v -n 'fbt::ip_input:entry'
   ID   PROVIDER            MODULE                          FUNCTION
NAME
37546        fbt                ip                          ip_input
entry

        Probe Description Attributes
                Identifier Names: Private
                Data Semantics:   Private
                Dependency Class: Unknown

        Argument Attributes
                Identifier Names: Private
                Data Semantics:   Private
                Dependency Class: ISA

        Argument Types
                args[0]: struct ill_s *
                args[1]: ill_rx_ring_t *
                args[2]: mblk_t *
                args[3]: struct mac_header_info_s *

The D compiler used its CTF data for the ip module to determine the arguments and their types. We can then run something like:

# dtrace -qn 'fbt::ip_input:entry{ print(*args[0]); exit(0) }'
...
struct ill_s {
    pfillinput_t ill_inputfn = ip`ill_input_short_v4
    ill_if_t *ill_ifptr = 0xffffff0148a27ab8
    queue_t *ill_rq = 0xffffff014b65ba60
    queue_t *ill_wq = 0xffffff014b65bb58
    int ill_error = 0
    ipif_t *ill_ipif = 0xffffff014b6fc460
    uint_t ill_ipif_up_count = 0x1
    uint_t ill_max_frag = 0x5dc
    uint_t ill_current_frag = 0x5dc
    uint_t ill_mtu = 0x5dc
    uint_t ill_mc_mtu = 0x5dc
    uint_t ill_metric = 0
    char *ill_name = 0xffffff014bc642c8
...
}

DTrace uses the CTF data for the struct ill_s to interpret all of the data and correlate it with the appropriate members.

Bringing it to Userland

While DTrace happily consumes all of the CTF data for the various kernel modules, up to now it simply ignored all of the CTF data in userland applications. With my changes, DTrace will now consume that CTF data for referenced processes. Let’s go back to the example that we opened this blog post with. If we list those probes verbosely we see:

# dtrace -l -v -n
# 'pid$target::stop_instance:entry,pid$target::start_instance:entry' -p
# $(pgrep -o startd)
   ID   PROVIDER            MODULE                          FUNCTION
NAME
62420       pid8        svc.startd                     stop_instance
entry

        Probe Description Attributes
                Identifier Names: Private
                Data Semantics:   Private
                Dependency Class: Unknown

        Argument Attributes
                Identifier Names: Private
                Data Semantics:   Private
                Dependency Class: Unknown

        Argument Types
                args[0]: userland scf_handle_t *
                args[1]: userland restarter_inst_t *
                args[2]: userland stop_cause_t

62419       pid8        svc.startd                    start_instance
entry

        Probe Description Attributes
                Identifier Names: Private
                Data Semantics:   Private
                Dependency Class: Unknown

        Argument Attributes
                Identifier Names: Private
                Data Semantics:   Private
                Dependency Class: Unknown

        Argument Types
                args[0]: userland scf_handle_t *
                args[1]: userland restarter_inst_t *
                args[2]: userland int32_t

Before this change, the Argument Types section would be empty. Because svc.startd has CTF data, DTrace was able to figure out the types of startd’s functions. Without these changes, you’d have to manually define the types of a scf_handle_t and a restarter_inst_t and cast the raw arguments to the correct type. If you ended up with a structure that has a lot of nested structures, defining all of them in D can quickly become turtles all the way down.

Look Ma, no copyin!

DTrace runs in a special context in the kernel, and often times DTrace requires you to think about what’s going on. Just as the kernel can’t access arbitrary user memory without copying it in, neither can DTrace. Consider the following classic one liner:

dtrace -n 'syscall::open:entry{ trace(copyinstr(arg0)); }'

You’ll note that we have to use copyinstr. That tells DTrace that we need to copy in the string from userland into the kernel in order to do something with it, whether that be an aggregation, printing it out, or saving it for some later action. This copyin isn’t limited to just strings. If you wanted to dereference some member of a structure, you’d have to either copy in the full structure, or manually determine the offset location of the member you care about.

At the previous illumos hackathon, Adam Leventhal had the idea of introducing a keyword into D, the DTrace language, that would tell the D compiler that a type is from userland. The D compiler would then take care of copying in the data automatically. Together we built a working prototype, with the keyword userland.

While certainly useful on its own, it really shines when combined with CTF data, as in the pid provider. The pid provider automatically applies the userland keyword to all of the types that are found in args[]. This allowed us to skip the copyin of intermediate structures and write a simple expression. eg. in our initial example we are able to do something that looks like a normal dereference in C: args[1]->ri_i.i_fmri. Before this change, you would have had to do three copyins: one for args[1], one for ri_i, and a final one for the string i_fmri.

As an example of the kinds of scripts that motivated this, here’s a portion of a D script that I used to help debug part of an issue inside of QEMU and KVM:

$ cat event.d
...
/* After its mfence */
pid$target::vring_notify:entry
/self->trace/
{
    self->arg = arg1;
    this->data = (char *)(copyin(self->arg + 0x28, 8));
    self->sign = *(uint16_t *)(this->data+0x2);
}

...

pid$target::vring_notify:return
/self->trace && self->arg/
{
    this->data =  (char *)(copyin(self->arg + 0x28, 8));
    printf("%d notify signal index: 0x%04x notify? %d\n", timestamp,
        *(uint16_t *)(this->data + 0x2), arg1);
}
...

There are many parts of this script where I’ve had to manually encode structure offsets and structure sizes. In the larger script, I had to play games with looking at registers and the pid provider’s ability to instrument arbitrary assembly instructions. I for one am glad that I’ll have to write a lot less of these.

When you have no CTF

While no binary should be left behind, not everything has CTF data today. But the userland keyword can still be incredibly useful even without it. Whenever you’re making a cast, you can note that the type is a userland type with the userland keyword, and the D compiler will do all the heavy lifting from there.

Here’s an example from a program that has a traditional linked list, but doesn’t have any CTF data:

struct foo;

typedef struct foo {
        struct foo *foo_next;
        char *foo_value;
} foo_t;

pid$target::print_head:entry
{
        this->p = (userland foo_t *)arg0;
        trace(stringof(this->p->foo_next->foo_next->foo_value));
}

The nice thing with the userland keyword is that you don’t have to do any copyin or worry about figuring out structure sizes. The goal with all of this is to make it simpler and more intuitive to write D scripts.

Referring to types

As a part of all this, you can refer to types in arbitrary processes that are running on the system, as well as the target. The syntax is designed to be flexible enough to allow you to specify not just the pid, but the link map, library, and type name, but you can also just specify the pid and type that you want. While you can’t refer to macros inside these definitions, you can use the shorthand `pid“ to refer to the value of $TARGET.

For example, say you wanted to refer to a glob_t, which on illumos is defined via a typdef struct glob_t { ... } glob_t, there are a lot of different ways that you can do that. The following are all equivalent:

dtrace -n 'BEGIN{ trace((pid`glob_t *)0); }' -p 8
dtrace -n 'BEGIN{ trace((pid`libc.so.1`glob_t *)0); }' -p 8
dtrace -n 'BEGIN{ trace((pid`LM0`libc.so.1`glob_t *)0); }' -p 8
dtrace -n 'BEGIN{ trace((pid8`glob_t *)0); }'
dtrace -n 'BEGIN{ trace((pid8`libc.so.1`glob_t *)0); }'
dtrace -n 'BEGIN{ trace((pid8`LM0`libc.so.1`glob_t *)0); }'

dtrace -n 'BEGIN{ trace((struct pid`glob_t *)0); }' -p 8
dtrace -n 'BEGIN{ trace((struct pid`libc.so.1`glob_t *)0); }' -p 8
dtrace -n 'BEGIN{ trace((struct pid`LM0`libc.so.1`glob_t *)0); }' -p 8
dtrace -n 'BEGIN{ trace((struct pid8`glob_t *)0); }'
dtrace -n 'BEGIN{ trace((struct pid8`libc.so.1`glob_t *)0); }'
dtrace -n 'BEGIN{ trace((struct pid8`LM0`libc.so.1`glob_t *)0); }'

All of these would also work with the userland keyword. The userland keyword interacts with structs a bit differently than one might expect, so let’s show all of our above examples with the userland keyword:

dtrace -n 'BEGIN{ trace((userland pid`glob_t *)0); }' -p 8
dtrace -n 'BEGIN{ trace((userland pid`libc.so.1`glob_t *)0); }' -p 8
dtrace -n 'BEGIN{ trace((userland pid`LM0`libc.so.1`glob_t *)0); }' -p 8
dtrace -n 'BEGIN{ trace((userland pid8`glob_t *)0); }'
dtrace -n 'BEGIN{ trace((userland pid8`libc.so.1`glob_t *)0); }'
dtrace -n 'BEGIN{ trace((userland pid8`LM0`libc.so.1`glob_t *)0); }'

dtrace -n 'BEGIN{ trace((struct userland pid`glob_t *)0); }' -p 8
dtrace -n 'BEGIN{ trace((struct userland pid`libc.so.1`glob_t *)0); }' -p 8
dtrace -n 'BEGIN{ trace((struct userland pid`LM0`libc.so.1`glob_t *)0); }' -p 8
dtrace -n 'BEGIN{ trace((struct userland pid8`glob_t *)0); }'
dtrace -n 'BEGIN{ trace((struct userland pid8`libc.so.1`glob_t *)0); }'
dtrace -n 'BEGIN{ trace((struct userland pid8`LM0`libc.so.1`glob_t *)0); }'

What’s next?

From here you can get started with userland ctf and the userland keyword in DTrace in current releases of SmartOS. They’ll be making their way to an illumos distribution near you some time soon.

Now that we have this, we’re starting to make plans for the future. One idea that Adam had is to make it easy to scope a structure definition to a target process’s data model.

Another big task that we have is to make it easy to get CTF into programs and ideally, make it invisible to anyone using any compiler tool chain on illumos!

With that, happy tracing!

libumem was developed in 2001 by Jeff Bonwick and Jonathan Adams. While the Solaris implementation of malloc(3C) and free(3C) performed adequately for single threaded applications, it did not scale. Drawing on the work that was done to extend the original kernel slab allocator, Jeff and Jonathan brought it to userland in the form of libumem. Since then, libumem has even been brought to other operating systems. libumem offers great performance for multi-threaded applications, though there are a few cases where libumem doesn’t quite perform compared to libc and the allocators found in other operating systems like eglibc. The most common case for this is when you have short-lived small allocations, often less than 200 bytes.

What’s happening?

As part of our work with Voxer, they had uncovered some general performance problems that Brendan and I were digging into. We distilled this down to a small Node.js benchmark that was calculating a lot of md5 sums. As part of narrowing down the problem, I eventually broke out one of Brendan’s flame graphs. Since we had a CPU-bound problem, this allowed us to easily visualize and understand what’s going on. When you throw that under DTrace with jstack(), you get something that looks pretty similar to the following flame graph:

libc flamegraph

There are two main pieces to this flame graph. The first is performing the actual md5 operations. The second is creating and destroying the md5 objects and the initialization associated with that. In drilling down, we found that we were spending comparatively more time trying to handle the allocations. If you look at the flamegraph in detail, you’ll see that when calling malloc and free we’re spending a lot of that time in in the lock portions of libc. libc’s malloc has a global mutex. Using a simple DTrace script like dtrace -n 'pid$target::malloc:entry{ @[tid] = count(); }', we can verify that only one thread is calling into malloc, so we’re grabbing an uncontended lock. One’s next guess might be to try and run this with libumem to see if there is any difference. This gives us the following flame graph:

libumem flamegraph

You can easily spot all of the libumem related allocations because they are a bit more like towers that consist of a series of three functions calls. First to malloc(3C), then umem_alloc(3MALLOC), and finally umem_cache_alloc(3MALLOC). On top of that are additional stacks related to grabbing locks. In umem_cache_alloc there is still a lock that a thread has to grab. Unlike libc’s malloc, this lock is not a global lock. Each cache has a lock per-CPU, which, when combined with magazines allows for highly-parallel allocations. However, we’re only doing mallocs from one thread so this is an uncontested mutex lock. The key takeaway from this is that the uncontested mutex lock can still be problematic. This is also much trickier in user-land where there is a lot more to deal with when grabbing a lock. Compare the kernel implementation with the user-land implementation. One conclusion that you reach from this is that we should do something to get rid of the lock.

When getting rid of mutexes, one might first think of using atomics and trying to rewrite this to be lock-free. But, aside from the additional complexity that rewriting portions of this to be lock-free might induce, that doesn’t solve the fundamental problem: we don’t want to be synchronizing at all. Instead this suggests a different idea that other memory allocators have taken: adding a thread-local cache.

A brief aside: libumem and malloc design

As part of libumem’s design it creates a series of fixed size caches which it uses to handle allocations. These caches are sized from 8 bytes to 128KB, with the difference between caches growing larger with the cache size. If a malloc comes in that is within the range of one of these caches then we use the cache. If the allocation is larger than 128KB then libumem uses a different means to allocate that. For the rest of this entry we’ll only talk about the allocations that are handled by one these caches. For the full details of libumem, I strongly suggest you read the two papers on libumem and the original slab allocator.

Keeping track of your allocations

When you call malloc(3C) you pass in a size, but you don’t need to pass that size back into free(3C). You only need to pass in the buffer. malloc ends up doing work to handle this for you. malloc will actually allocate an extra eight byte tag and prepend that to the buffer. So if you request a 36 bytes, malloc will actually allocate 42 bytes from the system and return you a pointer that starts right after that tag. This tag encodes two pieces of information. The first piece is the size and the second piece is a tag that is encoded with the size. It uses the second field to help detect programs that erroneously write to memory. The structure that it prepends looks like:

typedef struct malloc_data {
	uint32_t malloc_size;
	uint32_t malloc_stat;
} malloc_data_t;

When you call free, libumem grabs that structure, reads the buffer size, and validates the tag. If everything checks out, it releases the entire buffer back to the appropriate cache. If it doesn’t check out, libumem aborts the program.

Per-Thread Caching: High-level

To speed up the allocation and free process, we’re going to change how malloc and free work. When a given thread calls free, instead of releasing the buffer directly back to the cache, we will instead store it with the thread. That way if the thread comes around and requests a buffer that would be satisfied by that cache, it can just take the one that it stored. By creating this per-thread cache, we have a lock-free and contention-free means of servicing allocations. We store these allocations as a linked list and use one list per cache. When we want to add a buffer to the list, we make it the new head. When we remove an entry from the list, we remove the head. If the head is set to NULL then we know that the list is empty. When the list is empty, we simply go ahead and use the normal allocation path. When a thread exits, then all of the buffers in that thread are freed back to the underlying caches.

We don’t want the per-thread cache to end up storing an unbounded amount of memory. That would end up appearing no different from a memory leak. Instead, we have two mechanisms in place to control this.

  1. A cap on the amount of memory each thread may cache.
  2. We only enable this for a subset of umem caches.

By default, each thread is capped at 1 MB of cache. This can be configured on a per process basis using the UMEM_OPTIONS environment variable. Simply set perthread_cache=[size]. The size is in bytes and you can use the common K, M, G, and even T, suffixes. We only support doing this for sixteen caches at this time and we opt to make this the first sixteen caches. If you don’t tune the cache sizes, allocations up to 256 bytes for 32-bit applications and up to 448 bytes for 64-bit applications will be cached.

Finally, when a thread exits, all of the memory in that thread’s cache is released back to the underlying general purpose umem caches.

Another aside: Position Independent Code

Modern libraries are commonly built with Position Independent Code (PIC). The goal of building something PIC is that it can be loaded anywhere in the address space and no additional relocations will need to be performed. This means that all the offsets and addresses within a given library that are for the library itself are relative addresses. The means for doing this for amd64 programs is relatively straightforward. amd64 offers an addressing mode known as RIP-relative. RIP-relative addressing is where you specify an offset relative to the current instruction pointer which is stored in the register %rip. 32-bit i386 programs don’t have RIP-relative addressing, so compilers have to use different tricks to for relative addressing. One of the more common techniques is to use a call +0 instruction to establish a known address. Here is the disassembly of a simple function which happens to call a global function pointer in a library.

amd64-implementation
> testfunc::dis
testfunc:                         movq   +0x1bb39(%rip),%rax      <0x86230>
testfunc+7:                       pushq  %rbp
testfunc+8:                       movq   %rsp,%rbp
testfunc+0xb:                     call   *(%rax)
testfunc+0xd:                     leave
testfunc+0xe:                     ret
i386-implementation
> testfunc::dis
testfunc:                         pushl  %ebp
testfunc+1:                       movl   %esp,%ebp
testfunc+3:                       pushl  %ebx
testfunc+4:                       subl   $0x10,%esp
testfunc+7:                       call   +0x0     <testfunc+0xc>
testfunc+0xc:                     popl   %ebx
testfunc+0xd:                     addl   $0x1a990,%ebx
testfunc+0x13:                    pushl  0x8(%ebp)
testfunc+0x16:                    movl   0x128(%ebx),%eax
testfunc+0x1c:                    call   *(%eax)
testfunc+0x1e:                    addl   $0x10,%esp
testfunc+0x21:                    movl   -0x4(%ebp),%ebx
testfunc+0x24:                    leave
testfunc+0x25:                    ret

Position independent code is still really quite useful, one just has to be aware that they do pay a small price for it. In this case, we’re doing several more loads and stores. When working in intensely performance-sensitive code, those can really add up.

Per-Thread Caching: Implementation

The first problem that we needed to solve for per-thread caching was to figure out how we would store the data for the per-thread caches. While we could have gone with some of the functionality provided by the threading libraries (see threads(5)), that would end up sending us through the Procedure Linkage Table (PLT). Because we are cycle-bumming here our goal is to minimize the number of such calls that we have to make. Instead, we’ve added some storage to the ulwp_t. The ulwp_t is libc’s per-thread data structure. It is the userland equivalent of the kthread_t. We extended the ulwp_t of each thread with the following structure:

typedef struct {
	size_t tm_size;
	void *tm_roots[16];
} tmem_t;

Each entry in the tm_roots array is the head of one of the linked lists that we use to store a set of similarly sized allocations. The tm_size field keeps track of how much data has been stored across all of the linked lists for this thread. Because these structures exist per-thread, there is no need for any synchronization.

Why we need to know about the size of the caches

The set of caches that libumem uses for allocations only exists once umem_init() has finished processing all of the UMEM_OPTIONS environment variables. One of the options can add additional caches and another one can remove caches. It is impossible to know what these caches are at compile time. Given that this is the case, you might ask why do we want to know the size of the caches that libumem creates? Why not just create our own set of sizes that we’re going to use for honoring other allocations?

Failing to use the size of the umem caches would not only cause us to use extra space, but it would also cause us to incur additional fragmentation. Our goal is to be able to reuse these allocations. We can’t have a bucket for every possible allocation size, that would grow quite unwieldy. Let’s say that we used the same bucketing scheme that libumem uses by default. Because we have no way of knowing what cache libumem honored something from, we instead have to assume that the returned allocation is the largest possible size we can use the buffer for. If we make a 65-byte allocation that actually comes from the 80 byte cache, we would instead bucket it in the thread’s 64-byte cache. Effectively, we have to always round an allocation down to the next cache. Items that could satisfy a 64-byte allocation would end up being items that were originally 64-79 bytes large. This is clearly wasteful of our memory.

If you look at the signature of umem_free(3MALLOC) you’ll see that it takes a size argument. This means that it is our responsibility to keep track of what the original size of the allocation was. Normally malloc and free wrap this up in the malloc tags, but since we are reusing buffers, we’ll want to keep track of both the original size and the currently requested size when we reuse it. To do this, we would have to extend the malloc tag structure that we talked about above. While there are some allocations that have extra space for something like this for 64-bit programs, that is not the case for 32-bit programs. To implement it this way, that would require at another eight-byte tag be prepended to every 32-bit malloc and some 64-bit allocations as well.

Obviously this is not an ideal way to go approach the problem. Instead, if we use the cache sizes we don’t have to suffer from either of the above problems. We know that when a umem_alloc comes in, it rounds the allocation size up to the nearest cache to satisfy the request. We leverage that same idea so that when a buffer is freed we put it into the per-thread list that corresponds to the cache that it originally came from. When new requests come in we can use that buffer to satisfy anything that the underlying cache would be able to. Because of this strategy we don’t have to have a second round of fragmentation for our buffers. Similarly, because we know what the cache size is, we don’t have to keep track of the original request size. We know exactly what cache the buffer came from initially.

Following in the footsteps of trapstat and fasttrap

Now that we have opted to know about the cache sizes at run time this means that we have a few approaches we can take to generate the function that handles this per-thread layer. Remember, that we’re here because of performance. We need to cycle-bum and minimize our use of cycles. Loads and stores to and from main memory are much more expensive than simple register arithmetic, comparisons, and small branches. While there is an array of allocations sizes, we don’t want to have to always load each entry from that array. We also have another challenge. We need to avoid doing anything that causes us to use the PLT. We don’t want to end up having a call +0 instruction so we can access 32-bit PIC code. There is one fortunate aspect of the umem caches. Once they are determined at runtime, they never change.

Armed with this information we end up down a different path: we are going to dynamically generate the assembly for our functions. This isn’t the first time this has been done in illumos. For an idea of what this looks like, see trapstat. Our code functions in a very similar way. We have blocks of assembly with holes for addresses and constants. These blocks get copied into executable memory and the appropriate constants get inserted in the correct place. One of the important pieces of this is that we don’t end up calling any other functions. If we detect an error or we can’t satisfy the allocation in the function itself, we end up jumping out to the original malloc and free reusing the same stack frame.

Reaching the assembly generated functions

Once we have generated the machine code, we have the challenge of making it be what applications reach when they call malloc(). This is complicated by the fact that calls to malloc can come in before we create and initialize the new functions as part of the libumem initialization. The standard way you might solve this is with a function pointer that you swap out at some point. However, having that global function pointer causes us to need to address that in a position independent way and adds noticeable overhead. Instead we utilized a small feature of the illumos linker, local auditing, to create a trampoline. Before we get into the details of the auditing library, here’s the data we used to support the decision. We made a small and simple benchmark that just does a fixed number of small mallocs and frees in a loop and compared the differences.

#include <stdlib.h>
#include <stdint.h>
#include <stdio.h>
#include <sys/time.h>

#define MAX     1024 * 1024 * 512

int
main(int argc, char *argv[])
{
        int ii;
        void *f;
        int size = 4;
        hrtime_t start;

        if (argc == 2)
                size = atoi(argv[1]);

        start = gethrtime();
        for (ii = 0; ii < MAX; ii++) {
                f = malloc(4);
                free(f);
        }
        printf("%lld\n", (hrtime_t)(gethrtime() - start));
        return (0);
}

arch libc (ns) libumem (ns) indirect call (ns) audit library (ns)
i386 39833278751 57784034737 14522070966 9215801785
amd64 32470572792 47828105321 9654626131 8980269581

From this data we can see that the audit library technique ended up being a small win on amd64, but for i386, it was a much more substantial win. This all comes down to how the compiler generated PIC code.

Audit libraries are a feature of the illumos linker that allow you to interpose on all the relocations that are being made to and from a given library. For the full details on how audit libraries work consult the Linkers and Libraries guide (one of the best pieces of Sun Documentation) or the linker source itself. We created a local auditing library that allows us to only audit libumem. As part of auditing the relocation for libumem's malloc and free symbols the audit library gives us an opportunity to replace the symbol with one of our own choice. The audit library instead returns the address of a local buffer which contains a jump instruction to the either the actual malloc or free. This installs our simple trampoline.

Later, when umem_init() runs we end up generating the assembly versions of our functions. libumem uses symbols which the auditing library interposes upon to be told where the buffers it should put the generated function are. After both the malloc and free implementations have been successfully generated, it removes the initial jump instruction and atomically replaces it with a five byte nop instruction. We looked at using both the multi-byte nop, five single byte nops, and just zeroing out the jump offset so it would become a jmp +0. Using the same microbenchmark we used earlier, we saw that the multi-byte nop made a noticeable difference.

arch jmp +0 (ns) single-byte nop (ns) multi-byte nop (ns)
i386 9215801785 9434344776 9091563309
amd64 8980269581 8989382774 8562676893

For more details on how this all works and fits together, take a look at the updated libumem big theory statement and pay particular attention to section 8. You may also want to look at the i386 and amd64 specific files which generate the assembly.

Needed linker fixes

There are two changes that are necessary for local auditing to work correctly. Thanks to Bryan who went and made those changes and figured out the way to create this trampoline with the local auditing library.

Understanding per-thread cache utilization

Bryan worked to supply not only the necessary enhancements to the linker, but also supply enhancements to various mdb dcmds to better understand the behavior of the per-thread caching in libumem. ::umastat was enhanced to show both the amount that each thread has used and to show how many allocations each cache has in the per-thread cache (ptc).

> ::umastat
     memory   %   %   %   %   %   %   %   %   %   %   %   %   %   %   %   %   %
tid  cached cap   8  16  32  48  64  80  96 112 128 160 192 224 256 320 384 448
--- ------- --- --- --- --- --- --- --- --- --- --- --- --- --- --- --- --- ---
  1    174K  16   0   6   6   1   4   0   0  18   2  50   0   4   0   1   0   2
  2       0   0   0   0   0   0   0   0   0   0   0   0   0   0   0   0   0   0
  3    201K  19   0   6   6   2   4   8   1  16   2  43   0   3   0   1   0   1
  4       0   0   0   0   0   0   0   0   0   0   0   0   0   0   0   0   0   0
  5   62.1K   6   0   8   7   3   9   0   0  13   5  38   0   6   0   2   1   0
  6       0   0   0   0   0   0   0   0   0   0   0   0   0   0   0   0   0   0

cache                        buf     buf     buf     buf  memory     alloc alloc
name                        size  in use  in ptc   total  in use   succeed  fail
------------------------- ------ ------- ------- ------- ------- --------- -----
umem_magazine_1               16      33       -     252      4K        35     0
umem_magazine_3               32      36       -     126      4K        39     0
umem_magazine_7               64       0       -       0       0         0     0
umem_magazine_15             128       4       -      31      4K         4     0
umem_magazine_31             256       0       -       0       0         0     0
umem_magazine_47             384       0       -       0       0         0     0
umem_magazine_63             512       0       -       0       0         0     0
umem_magazine_95             768       0       -       0       0         0     0
umem_magazine_143           1152       0       -       0       0         0     0
umem_slab_cache               56      46       -      63      4K        48     0
umem_bufctl_cache             24     153       -     252      8K       155     0
umem_bufctl_audit_cache      192       0       -       0       0         0     0
umem_alloc_8                   8       0       0       0       0         0     0
umem_alloc_16                 16    2192    1827    2268     36K      2192     0
umem_alloc_32                 32    1082     921    1134     36K      1082     0
umem_alloc_48                 48     275     202     336     16K       275     0
umem_alloc_64                 64     487     359     504     32K       487     0
umem_alloc_80                 80     246     234     250     20K       246     0
umem_alloc_96                 96      42      41      42      4K        42     0
umem_alloc_112               112     741     676     756     20K       741     0
umem_alloc_128               128     133     109     155     20K       133     0
umem_alloc_160               160    1425    1274    1425     36K      1425     0
umem_alloc_192               192      11       9      21      4K        11     0
umem_alloc_224               224      83      82      90     20K        83     0
umem_alloc_256               256       8       8      15      4K         8     0
umem_alloc_320               320      24      22      24      8K        24     0
umem_alloc_384               384       7       6      10      4K         7     0
umem_alloc_448               448      20      19      27     12K        20     0
umem_alloc_512               512       1       -      16      8K       138     0
umem_alloc_640               640       0       -      18     12K       130     0
umem_alloc_768               768       0       -      10      8K        87     0
umem_alloc_896               896       0       -      18     16K       114     0
...

In addition, this work inspired Bryan to go and add %H to mdb_printf for human readable sizes. As a part of the support for the enhanced ::umastat, there are also new walkers for the various ptc caches.

Performance of the Per-Thread Caching

The ultimate goal of this was to improve our performance. As part of that we did different testing to make sure that we understood what the impact and effects of this would be. We primarily compared ourselves to the libc malloc implementation and a libumem without our new bits. We also did some comparison to other allocators, notably eglibc. We chose eglibc because that is what the majority of customers coming to us from other systems are using and because it is a good allocator, particularly for small objects.

Tight 4 byte allocation loop

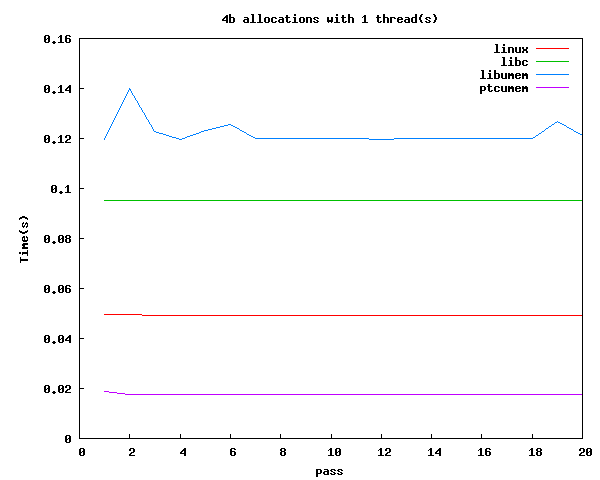
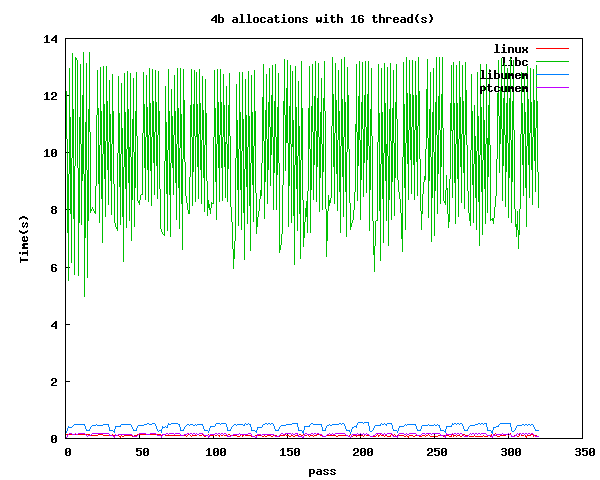
One of the basic things that we wanted to test, inspired in part by some of the behavior we had seen in applications, was to measure what a tight malloc and free loop of a small allocation looked like where we varied the number of threads. Below we included a test where we did this one thread and one where we did it with sixteen threads. The main take away we got from this is that libumem has historically been slow at these compared to a single threaded libc program. The sixteen thread graph shows why we really want to use libumem compared to libc. The graph shows the time per thread. As we can see, libc's single mutex for malloc is rather painful.

4 byte allocations with one thread
4 byte allocations with sixteen threads

Time for all cached allocations

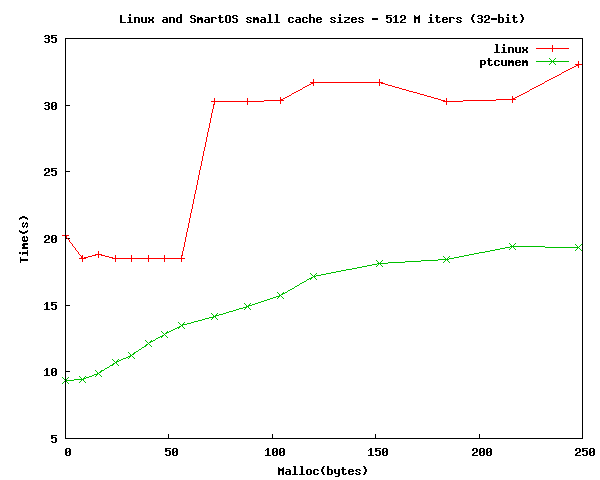
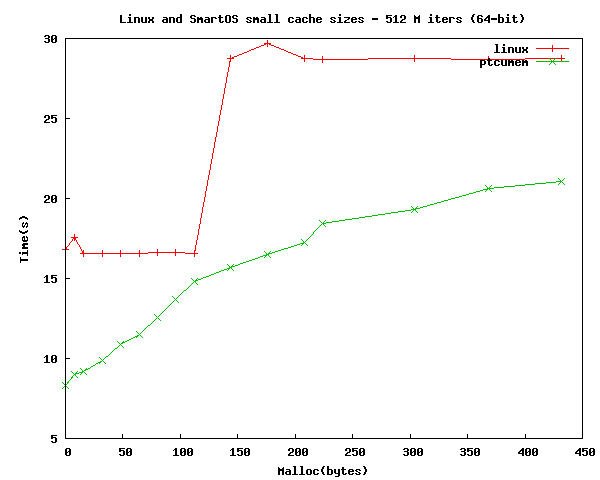
Another thing that we wanted to measure was how our allocation time scaled with the size of the cache. While our assembly is straightforward, it could probably be further optimized. We ran the test with both 32-bit and 64-bit code and the results are below. From the graphs you can see that scale fairly linearly across the caches.

32-bit small allocations
64-bit small allocations

The effects of the per-thread cache on uncacheable allocations

One of the things that we wanted to verify was that the presence of the per-thread caching did not unreasonably degrade the performance of other allocations. To look at this we compared what happened if you used libumem and what happened if you did not. We used pbind to lock the program to a single CPU, measured the time it took to do 1KB sized allocations, and compared the differences. We took that value and divided by the total number of allocations we had performed, 512 M in this case. The end result was that for a given loop of malloc and free, the overhead was 8-10ns. That was within reason for our acceptable overhead.

umem_init time

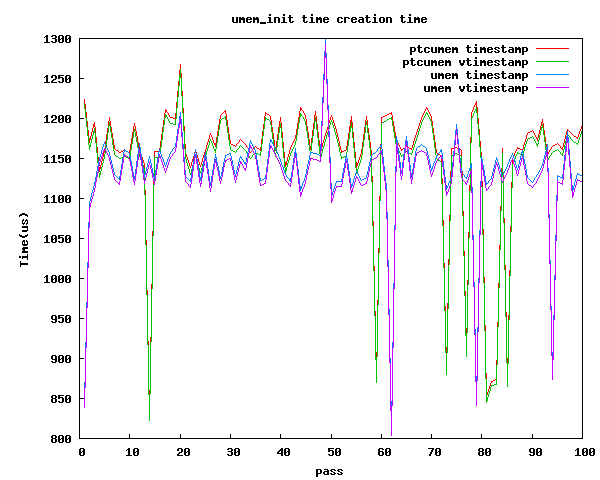
Another one of the areas we wanted to make sure that we didn't seriously regress was the time it takes umem_init. I've included a coarse graph that was created using DTrace. I simply rigged up something that traced the amount of wall and cpu time umem_init took. We repeated that 100 times and graphed the results. The graph below shows a roughly 50 microsecond increase in the wall and cpu time. In this case, a reasonable increase.

umem_init time

Our Original Flame Graph

The last thing that I want to look at is what the original flame graph now looks like using per-thread-caching. We increased the per-thread cache to 64MB because that allows us to cache the majority of the malloc activity which primarily comes from only one thread. The new flame graph is different from the previous two. The amount of time that we've spent in malloc and free has been minimized and compared to libumem previously, we are no longer three layers deep. In terms of raw improvement, while this normally took around 110 seconds with libc, with per-thread-caching we're down to around 78 seconds. Remember, this is a pure node.js benchmark. To have an improvement to malloc() result in a ~30% win was pretty surprising. Even in dynamic garbage collected languages, the performance of malloc is still important.

ptcumem flamegraph

Wrapping Up

In this entry I've described the high-level design, implementation, and some of the results we've seen from our work on per-thread caching libumem. For some workloads there can be a substantial performance improvement by using per-thread caching. To try it out, grab the upcoming release of SmartOS and either add -lumem to your Makefile or simply try it out by running your application with LD_PRELOAD=libumem.so.

When you link with libumem, per-thread caching is enabled by default with a 1 MB per-thread cache. This value can be tuned via the UMEM_OPTIONS environment variable via UMEM_OPTION=perthread_cache=[size]. For example, to set it to 64 MB, you would do something like: UMEM_OPTIONS=perthread_cache=64M. If you enable any kind of the umem_debug(3MALLOC) facilities then this will be disabled. Similarly if you request nomagazines, this will be disabled.

If you have questions, feel free to ask here or join us on IRC.

Last October, the first illumos hack-a-thon took place. Out of that a lot of interesting things were done and have since been integrated into illumos. Two of the more interesting gems were Adam Leventhal and Matt Ahrens adding dtrace -x temporal and Eric Schrock adding the DTrace print() action. Already print() is in the ranks of things where once you have it you really miss it when you don’t. During the hack-a-thon I had the chance to work Matt Amdur. Together we worked on another one of those nice to haves that has finally landed in illumos: tab completion for mdb.

md-what?

For those who have never used it, mdb is the Modular Debugger that comes as a part of illumos and was originally developed for Solaris 8. mdb is primarily used for post-mortem of user and kernel applications and kernel debugger. mdb isn’t a source level debugger, but it works quite well on core dumps from userland, inspects and modifies live kernel state without stopping the system, and provides facilities for traditional debugging where a program is stopped, stepped over, and inspected. mdb replaced adb which came out of AT&T. While mdb isn’t 100% compatible with adb, it does remind you that there’s ‘No algol 68 here’. For the full history, take a look at Mike Shapiro’s talk that he gave at the Brown CS 37th IPP Symposium.

One of the more useful pieces of mdb is its module API which allows other modules to deliver specifically tailored commands and walkers. This is used for everything from the v8 Javascript Engine to understanding cyclics. Between that, pipelines, and other niceties, there isn’t too much else you could want from your debugger.

What’s involved

The work that we’ve done falls into three parts:

  • A tab completion engine.
  • Changes to the module API and several new functions to allow dcmds
    to implement their own tab completion.
  • Tab completion support for several dcmds

Thanks to CTF data in the kernel, we can tab complete everything from walker names, to types and their members. We went and added tab completion to the following dcmds:

  • ::walk
  • ::sizeof
  • ::list
  • ::offsetof
  • ::print
  • The dcmds themselves

Seeing is believing: Tab completion in action

Completing dcmds

> ::pr[tab]
print
printf
project
prov_tab
prtconf
prtusb

Completing walkers

> ::walk ar[tab]
arc_buf_hdr_t
arc_buf_t
> ::walk arc_buf_

Completing types

> ::sizeof struct dt[tab]
struct dtrace_actdesc
struct dtrace_action
struct dtrace_aggbuffer
struct dtrace_aggdesc
struct dtrace_aggkey
struct dtrace_aggregation
struct dtrace_anon
struct dtrace_argdesc
struct dtrace_attribute
struct dtrace_bufdesc
struct dtrace_buffer
struct dtrace_conf
struct dtrace_cred
struct dtrace_difo
struct dtrace_diftype
struct dtrace_difv
struct dtrace_dstate
struct dtrace_dstate_percpu
struct dtrace_dynhash
struct dtrace_dynvar
struct dtrace_ecb
struct dtrace_ecbdesc
struct dtrace_enabling
struct dtrace_eprobedesc
struct dtrace_fmtdesc
struct dtrace_hash
...

Completing members

> ::offsetof zio_t io_v[tab]
io_vd
io_vdev_tree
io_vsd
io_vsd_ops

Walking across types with ::print

> p0::print proc_t p_zone->zone_n[tab]
zone_name
zone_ncpus
zone_ncpus_online
zone_netstack
zone_nlwps
zone_nlwps_ctl
zone_nlwps_lock
zone_nodename
zone_nprocs
zone_nprocs_ctl
zone_nprocs_kstat
zone_ntasks

In addition, just as you can walk across structure (.) and array ([]) dereferences in ::print invocations, you can also do the same with tab completion.

What’s next?

Now that mdb tab completion change is in illumos there’s already some work to add backends to new dcmds including:

  • ::printf
  • ::help
  • ::bp

What else would you like to see? Let us know in a comment or better yet, go ahead and implement it yourself!

One of the challenges when using any Operating System is answering the question ‘Is my hardware supported?’. To track this down, you often have to scour Internet sites, hoping someone else has already asked the question, or do other, more horrible machinations – or ask someone like me. If you’re running on an illumos-based system like SmartOS, OmniOS, or OpenIndiana, this just got a lot easier: I’ve created the list. Better yet, I’ve created a tool to automatically create the list.

The List

illumos now has a hardware compatibility list (HCL) available at http://illumos.org/hcl.

This list contains all the PCI and PCI Express devices that should work. If your PCI device isn’t listed there, don’t fret, it may still work. This list is a first strike at the problem of hardware compatibility, so things like specific motherboards aren’t listed there.

How it’s generated

The great thing about this list is that it’s automatically generated from the source code in illumos itself. Each driver on the system has a manifest that specifies what PCI IDs it supports. We parse each of these manifests and look up the names using the PCI ID Database, using a small library that I wrote. From there, we automatically generate the static web page that can be deployed. Thanks to K. Adam White for his invaluable help to stop me from fumbling around too much with front end web code and the others who have already come in and improved it.

All the code is available on github. The goal for all of this is to eventually be a part of the illumos-gate itself. If you have improvements or want to make the web page more visually appealing, we’d all welcome the contribution.

Last Monday was the illumos hack-a-thon. There, I worked with Matt Amdur on adding tab completion support to mdb — the illumos modular debugger. The hack-a-thon was wildly successful and a lot of fun, I hope to put together an entry on the hack-a-thon and give an overview of the projects that were worked on over the course of the next few days. During the hack-a-thon, Matt and I created a working prototype that would complete the types and members using ::print, but there was still some good work for us to do. One of the challenges that we were facing was some unexpected behavior whenever the mdb pager was invoked. We were seeing different actions depending on which actions you took from the pager: continue, quit, or abort.

If you take a look at the source code, you’ll see that sometimes we’ll leave this function by calling longjmp(3c). There’s a lot of different places that we call setjmp(3c) and sigsetjmp(3c) in mdb, so tracking down where we were going just based on looking at the source code would be tricky. So, we want to answer the question, where are we jumping to? There are a few different ways we can do this (and more that aren’t listed):

  1. Inspect the source code
  2. Use mdb to debug mdb
  3. Use the DTrace pid provider and trace a certain number of instructions before we assume we’ve gotten there
  4. Use the DTrace pid provider and look at the jmp_buf to get the address of where we were jumping

Ultimately, I decided to go with option four, knowing that I would have to solve this problem again at some point in the future. The first step is to look at the definition of the jmp_buf definition. For the full definition take a look at setjmp_iso.h. Here’s the snippet that actually defines the type:

     82 #if defined(__i386) || defined(__amd64) || \
     83 	defined(__sparc) || defined(__sparcv9)
     84 #if defined(_LP64) || defined(_I32LPx)
     85 typedef long	jmp_buf[_JBLEN];
     86 #else
     87 typedef int	jmp_buf[_JBLEN];
     88 #endif
     89 #else
     90 #error "ISA not supported"
     91 #endif

Basically, the jmp_buf is just an array where we store some of registers. Unfortunately this isn’t sufficient to figure out where to go. So instead, we need to take a look at the implementation. setjmp is implemented in assembly for the particular architecture. Here it is for x86 and amd64. Now that we have the implementation, let’s figure out what to do. As a heads up, if you’re looking at any of these .s files, the numbers are actually in base 10, which is different from what you get when you look at the mdb output which has them in hex. Let’s take a quick look at the longjmp source for a 32-bit system and dig into what’s going on and how we know what to do:

     73 	ENTRY(longjmp)
     74 	movl	4(%esp),%edx	/ first parameter after return addr
     75 	movl	8(%esp),%eax	/ second parameter
     76 	movl	0(%edx),%ebx	/ restore ebx
     77 	movl	4(%edx),%esi	/ restore esi
     78 	movl	8(%edx),%edi	/ restore edi
     79 	movl	12(%edx),%ebp	/ restore caller's ebp
     80 	movl	16(%edx),%esp	/ restore caller's esp
     81
     82 	movl	24(%edx), %ecx
     83 	test	%ecx, %ecx	/ test flag word
     84 	jz	1f
     85 	xorl	%ecx, %ecx	/ if set, clear ul_siglink
     86 	movl	%ecx, %gs:UL_SIGLINK
     87 1:
     88 	test	%eax,%eax	/ if val != 0
     89 	jnz	1f		/ 	return val
     90 	incl	%eax		/ else return 1
     91 1:
     92 	jmp	*20(%edx)	/ return to caller
     93 	SET_SIZE(longjmp)

The function is pretty well commented, so we can follow along pretty easily. Basically we load the jmp_buf that was passed in into %edx, add 0x14 to that value and then jump to that piece of code. So now we know exactly what the address we’re returning to is. With this in hand, we only have two tasks left: transforming this address into a function and offset, and doing this all with a simple DTrace script. Solving the first problem is actually pretty easy. We can just use the DTrace uaddr function which will translate it into an address and offset for us. The script itself is now an exercise in copyin and arithmetic. Here’s the main part of the script:

/*
 * Given a sigbuf translate that into where the longjmp is taking us.
 *
 * On i386 the address is 0x14 into the jmp_buf.
 * On amd64 the address is 0x38 into the jmp_buf.
 */

pid$1::longjmp:entry
{
        uaddr(curpsinfo->pr_dmodel == PR_MODEL_ILP32 ?
            *(uint32_t *)copyin(arg0 + 0x14, sizeof (uint32_t)) :
            *(uint64_t *)copyin(arg0 + 0x38, sizeof (uint64_t)));
}

Now, if we run this, here’s what we get:

[root@bh1-build2 (bh1) /var/tmp]# dtrace -s longjmp.d $(pgrep -z rm mdb)
dtrace: script 'longjmp.d' matched 1 probe
CPU     ID                    FUNCTION:NAME
  8  69580                    longjmp:entry   mdb`mdb_run+0x38

Now we know exactly where we ended up after the longjmp(), and this will method will work on both 32-bit and 64-bit x86 systems. If you’d like to download the script, you can just download it from here.

Last March, Bryan Cantrill and I joined Max Bruning on working towards bringing KVM to illumos. Six months ago we found ourselves looping in x86 real mode and today we’re booting everything from Linux to Plan 9 to Weenix! For a bit more background on how we got there take a gander at Bryan’s entry on KVM on illumos.

For the rest of this entry I’m going to talk about the exciting new analytics we get by integrating DTrace and kstats into KVM. We’ve only scratched the surface of what we can see, but already we’ve integrated several metrics into Cloud Analytics and have gained insight into different areas of guest behavior that the guests themselves haven’t really seen before. While we can never gain the same amount of insight into Virtual Machines (VMs) that we can with a zone, we easily have insight into three main resources of a VM: CPU, disk, and network. Cloud Operators can use these metrics to determine if there is a problem with a VM, determine which VMs are having issues, and what areas of the system are suffering. In addition, we’ve pushed the boundaries of observability by taking advantage of the fact that several components of the hardware stack are virtualized. All in all, we’ve added metrics in the following areas:

  • Virtual NIC Throughput
  • Virtual Disk IOps
  • Virutal Disk Throughput
  • Hardware Interrupts
  • Virtual Machine Exits
  • vCPU Samples

NICs and Disks

One of the things that we had to determine early on was how the guests virtual devices would interface with the host. For NICs, this was simple: rather than trying to map a guest’s NIC to a host’s TUN or TAP device; we just used a VNIC, which was introduced into the OS by the Crossbow project. Each guest NIC corresponds directly to a Crossbow VNIC. This allows us to leverage all of the benefits of using a VNIC including anti-spoof and the analytics that already exist. This lets us see the throughput in terms of either bytes or packets that the guest is sending and receiving on a per guest NIC basis.

The story with disks is quite similar. In this case each disk that the guest sees is backed by a zvol from ZFS. This means that guests unknowingly get the benefits of ZFS: data checksums, snapshots and clones, the ease of transfer via zfs send and zfs receive, redundant pooled storage, and a proven reliability. What is more powerful here is the insight that we can provide into the disk operations. We provide two different views of disk activity. The first is based on throughput and the second is based on I/O operations.

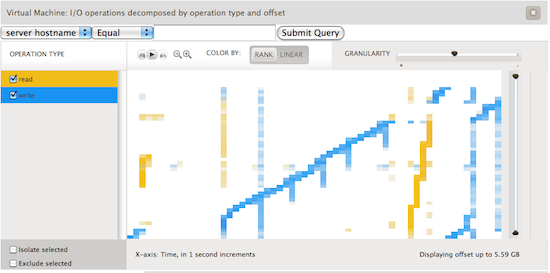
The throughput based analytics are a great way to understand the actual disk activity that the VM is doing. Yet the operations view gives us several interesting avenues to drill down into VM activity. The main decompositions are operation type, latency, offset, and size. This gives us insight into how guest filesystems are actually sending activity to disk. As an example, we generated the following screenshot from a guest running Ubuntu on an ext3 filesystem. The guest would loop creating a 3gb file, sleeping for a seconds, reading the file, and deleting the file before beginning again. In the image below we see operations decomposed by operation type and offset. This allows us to see where on disk ext3 is choosing to lay out blocks on the filesystem. The x-axis represents time; each unit is one second. The y-axis shows the virtual disk block number.

ext3 offsets

Hardware Interrupts

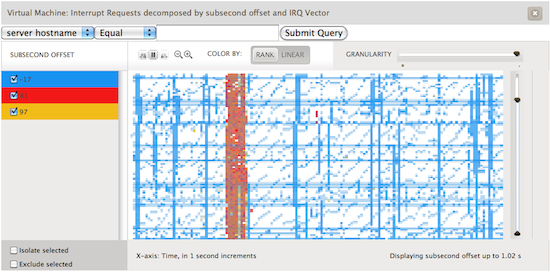
Brendan Gregg has been helping us out by diligently measuring our performance, comparing us to both a bare metal Linux system and KVM under Linux. While trying to understand the performance characteristics and ensuring that KVM on illumos didn’t have too many performance pathologies he stumbled across an interesting function in the kvm source code: vmx_inject_irq. This function is called any time a hardware interrupt is injected into the guest. We combined this information with an incredibly valuable idea for heatmaps that Brendan thought up. A heatmap based upon subsecond offset allows us to see when across a given second some action occurred. The x-axis is the same as the previous graph, one second. The y-axis though represents when in the second this item occurred, i.e. where in the 1,000,000 microseconds did this action occur. Take a look at the following image:

subsecond offset by irqs

Here we are visualizing which interrupts occurred in a given second and looking at it based upon when in the second they occur. Each interrupt vector is colored differently. The red represents interrupts caused by the disk controller and yellow by the network controller. The blue is the most interesting: these are timer based interrupts generated by the APIC. Lines that are constant across the horizontal means that these are events that are happening at the same time every second. These represent actions caused by an interval timer, something that
always fires every second. However there are lines that look like a miniature stair; ones that go up at an angle. These represent an application that does work, calls sleep(3C) for an interval, does a little bit of work and sleeps again.

VM Exits

A VM exits when the processor ceases running the guest code and returns to the host kernel to handle something which must be emulated such as memory mapped I/O or accessing one of the emulated devices. One of the ways to increase VM performance is to minimize the number of exits. Early on during our work porting KVM we saw that there were various statistics that were being gathered and exported via debugfs in the Linux KVM code. Here we leveraged kstats and Bryan quickly wrote up kvmstat. kvmstat quickly became an incredibly useful tool for us to easily understand VM behavior. What we’ve done is leverage the kstats which allow us to know which VM, which vCPU, and which of a multitude of reasons the guest exited and add that insight into Cloud Analytics.

vCPU Samples

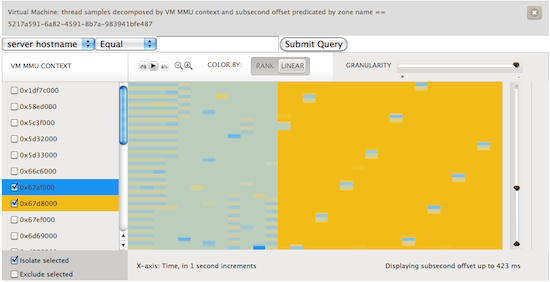
While working on KVM and reading through the Intel Architecture Manuals I reminded myself of a portion of x86 architecture that is quite important, mainly that the root of the page table is always going to be stored in cr3. Unique values in cr3 represent unique Memory Management Unit (MMU) contexts. Most modern operating systems that run on x86 use a different a different MMU context for each process running on the system and the kernel. Thus if we look at the value of cr3 we get an opaque token that represents something running in the guest.

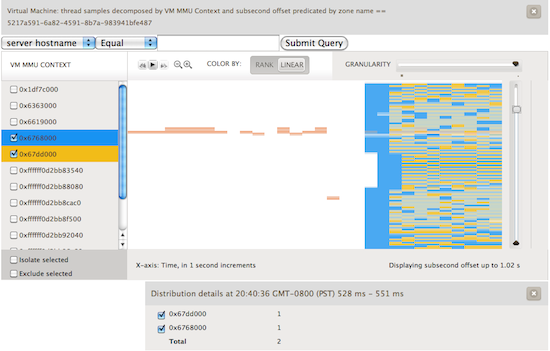
Brendan had recently been adding metrics to Cloud Analytics based upon using DTrace’s profile provider and combining the gathered data with the subsecond offset heatmaps that we previously discussed. Bryan had added a new variable to D that allowed us to look at the register state of a given running vCPU. To get the value of cr3 that we wanted we could use something along the lines of vmregs[VMX_GUEST_CR3]. When you combine these two we get a heatmap that shows us what is running in the guest. Check out the image below:

vCPU samples by cr3 and subsecond offset

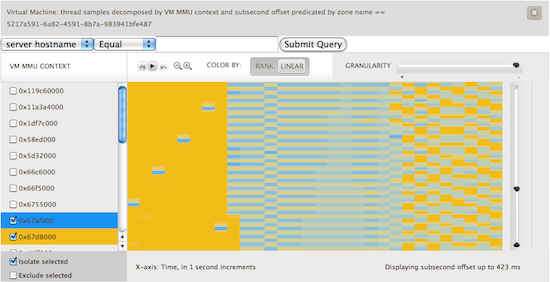
Here, we’ve sampled at a frequency of 99 Hz. We avoid sampling at 100 Hz because that would catch a lot of periodic system activity. We’re looking at a one CPU guest running Ubuntu. The guest is initially idle. Next we start two CPU bound activities, highlighted in blue and yellow. What we can visualize are the scheduling decisions being made by the Linux kernel. To further see what happened, we used renice on one of the processes setting it to a value of 19. You can see the effect in the first image below as the blue process rarely runs in comparison to the yellow. In the second image we experimented with the effects of setting different nice values.

vCPU samples by cr3 and subsecond offset

vCPU samples by cr3 and subsecond offset

These visualizations are quite useful. They let us give someone an idea of what is running in their VM. While it can’t pinpoint it to the exact process, it does let the user understand what the characteristics of their workload are and whether it is a few long lived processes fighting for the CPU, lots of short lived processes coming and going, or something in between. Like the rest of these metrics this lets you understand where in your fleet of VMs the problem may be occurring and help narrow things down to which few VMs should be looked at with native tools.

Conclusion

We’ve only begun to scratch the surface of what we can understand about a virtual machine running under KVM on illumos. Needless to say, this wouldn’t be possible without DTrace and its guarantees of safety for use on production systems and only the overhead of a few NOPs when not in use. As time goes on we’ll be experimenting on what information can help us, operators, and end users better understand their VM’s performance and adding those abilities to Cloud Analytics.

Recent Posts

September 27, 2019
September 6, 2019
October 1, 2014

Archives