Last March, Bryan Cantrill and I joined Max Bruning on working towards bringing KVM to illumos. Six months ago we found ourselves looping in x86 real mode and today we’re booting everything from Linux to Plan 9 to Weenix! For a bit more background on how we got there take a gander at Bryan’s entry on KVM on illumos.
For the rest of this entry I’m going to talk about the exciting new analytics we get by integrating DTrace and kstats into KVM. We’ve only scratched the surface of what we can see, but already we’ve integrated several metrics into Cloud Analytics and have gained insight into different areas of guest behavior that the guests themselves haven’t really seen before. While we can never gain the same amount of insight into Virtual Machines (VMs) that we can with a zone, we easily have insight into three main resources of a VM: CPU, disk, and network. Cloud Operators can use these metrics to determine if there is a problem with a VM, determine which VMs are having issues, and what areas of the system are suffering. In addition, we’ve pushed the boundaries of observability by taking advantage of the fact that several components of the hardware stack are virtualized. All in all, we’ve added metrics in the following areas:
- Virtual NIC Throughput
- Virtual Disk IOps
- Virutal Disk Throughput
- Hardware Interrupts
- Virtual Machine Exits
- vCPU Samples
NICs and Disks
One of the things that we had to determine early on was how the guests virtual devices would interface with the host. For NICs, this was simple: rather than trying to map a guest’s NIC to a host’s TUN or TAP device; we just used a VNIC, which was introduced into the OS by the Crossbow project. Each guest NIC corresponds directly to a Crossbow VNIC. This allows us to leverage all of the benefits of using a VNIC including anti-spoof and the analytics that already exist. This lets us see the throughput in terms of either bytes or packets that the guest is sending and receiving on a per guest NIC basis.
The story with disks is quite similar. In this case each disk that the guest sees is backed by a zvol from ZFS. This means that guests unknowingly get the benefits of ZFS: data checksums, snapshots and clones, the ease of transfer via zfs send and zfs receive, redundant pooled storage, and a proven reliability. What is more powerful here is the insight that we can provide into the disk operations. We provide two different views of disk activity. The first is based on throughput and the second is based on I/O operations.
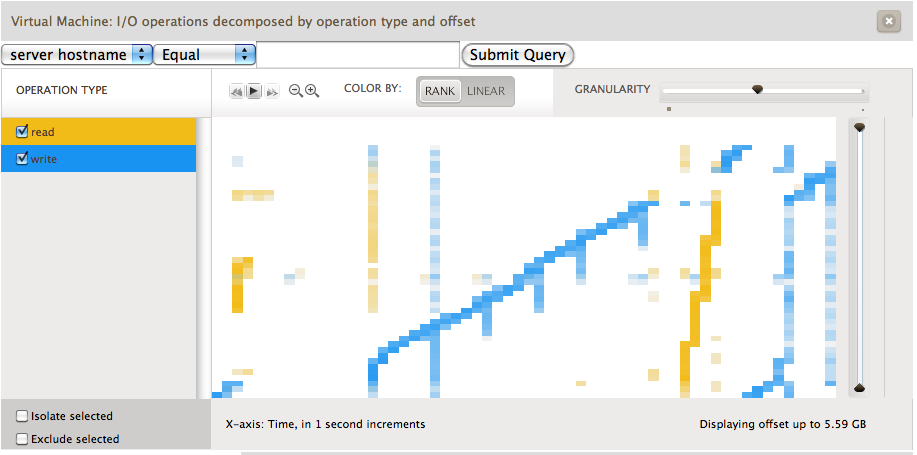
The throughput based analytics are a great way to understand the actual disk activity that the VM is doing. Yet the operations view gives us several interesting avenues to drill down into VM activity. The main decompositions are operation type, latency, offset, and size. This gives us insight into how guest filesystems are actually sending activity to disk. As an example, we generated the following screenshot from a guest running Ubuntu on an ext3 filesystem. The guest would loop creating a 3gb file, sleeping for a seconds, reading the file, and deleting the file before beginning again. In the image below we see operations decomposed by operation type and offset. This allows us to see where on disk ext3 is choosing to lay out blocks on the filesystem. The x-axis represents time; each unit is one second. The y-axis shows the virtual disk block number.
Hardware Interrupts
Brendan Gregg has been helping us out by diligently measuring our performance, comparing us to both a bare metal Linux system and KVM under Linux. While trying to understand the performance characteristics and ensuring that KVM on illumos didn’t have too many performance pathologies he stumbled across an interesting function in the kvm source code: vmx_inject_irq. This function is called any time a hardware interrupt is injected into the guest. We combined this information with an incredibly valuable idea for heatmaps that Brendan thought up. A heatmap based upon subsecond offset allows us to see when across a given second some action occurred. The x-axis is the same as the previous graph, one second. The y-axis though represents when in the second this item occurred, i.e. where in the 1,000,000 microseconds did this action occur. Take a look at the following image:
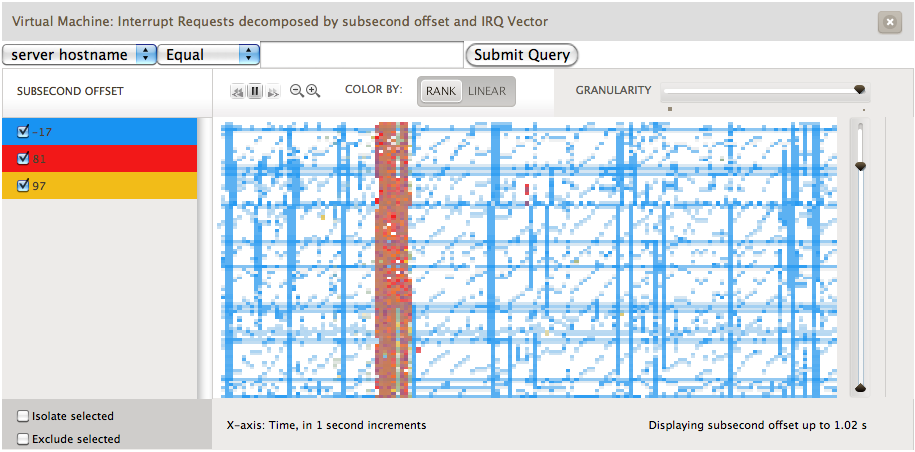
Here we are visualizing which interrupts occurred in a given second and looking at it based upon when in the second they occur. Each interrupt vector is colored differently. The red represents interrupts caused by the disk controller and yellow by the network controller. The blue is the most interesting: these are timer based interrupts generated by the APIC. Lines that are constant across the horizontal means that these are events that are happening at the same time every second. These represent actions caused by an interval timer, something that
always fires every second. However there are lines that look like a miniature stair; ones that go up at an angle. These represent an application that does work, calls sleep(3C) for an interval, does a little bit of work and sleeps again.
VM Exits
A VM exits when the processor ceases running the guest code and returns to the host kernel to handle something which must be emulated such as memory mapped I/O or accessing one of the emulated devices. One of the ways to increase VM performance is to minimize the number of exits. Early on during our work porting KVM we saw that there were various statistics that were being gathered and exported via debugfs in the Linux KVM code. Here we leveraged kstats and Bryan quickly wrote up kvmstat. kvmstat quickly became an incredibly useful tool for us to easily understand VM behavior. What we’ve done is leverage the kstats which allow us to know which VM, which vCPU, and which of a multitude of reasons the guest exited and add that insight into Cloud Analytics.
vCPU Samples
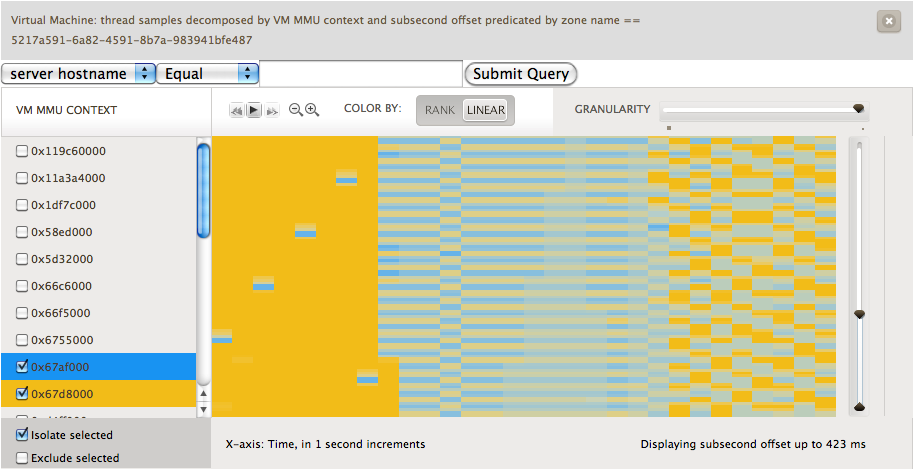
While working on KVM and reading through the Intel Architecture Manuals I reminded myself of a portion of x86 architecture that is quite important, mainly that the root of the page table is always going to be stored in cr3. Unique values in cr3 represent unique Memory Management Unit (MMU) contexts. Most modern operating systems that run on x86 use a different a different MMU context for each process running on the system and the kernel. Thus if we look at the value of cr3 we get an opaque token that represents something running in the guest.
Brendan had recently been adding metrics to Cloud Analytics based upon using DTrace’s profile provider and combining the gathered data with the subsecond offset heatmaps that we previously discussed. Bryan had added a new variable to D that allowed us to look at the register state of a given running vCPU. To get the value of cr3 that we wanted we could use something along the lines of vmregs[VMX_GUEST_CR3]. When you combine these two we get a heatmap that shows us what is running in the guest. Check out the image below:
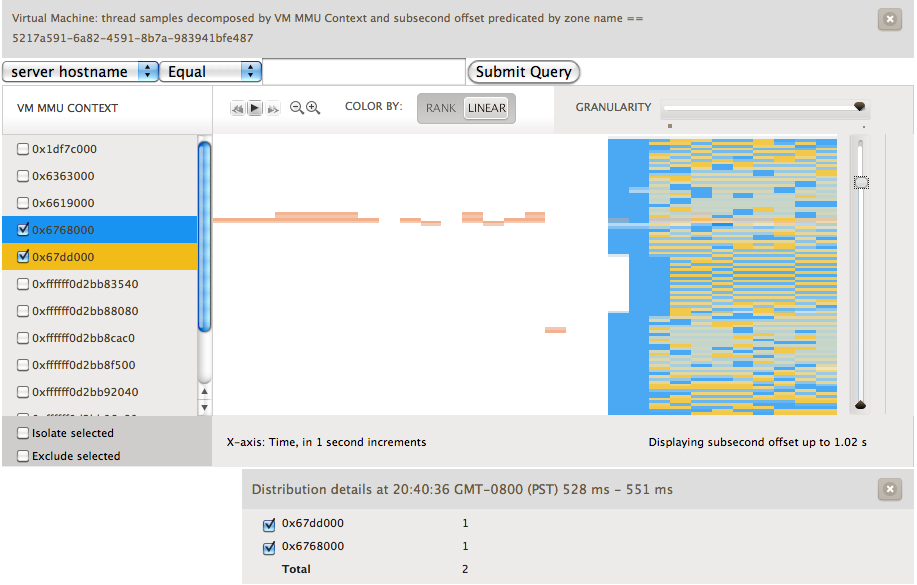
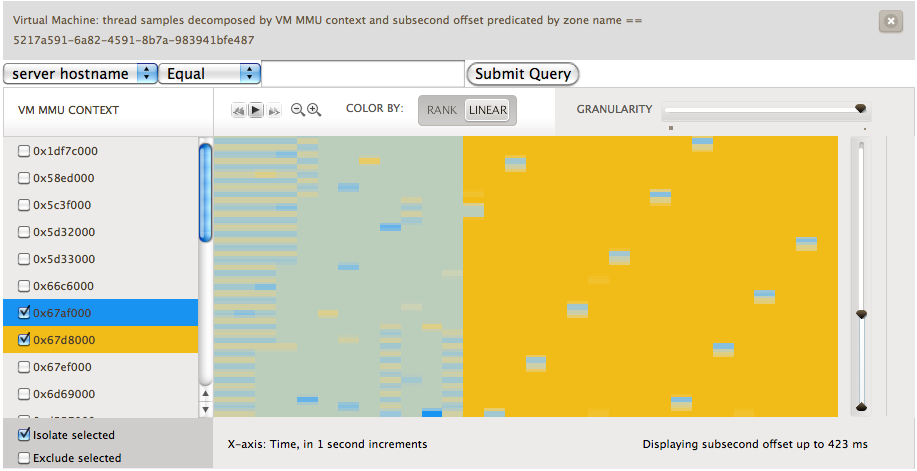
Here, we’ve sampled at a frequency of 99 Hz. We avoid sampling at 100 Hz because that would catch a lot of periodic system activity. We’re looking at a one CPU guest running Ubuntu. The guest is initially idle. Next we start two CPU bound activities, highlighted in blue and yellow. What we can visualize are the scheduling decisions being made by the Linux kernel. To further see what happened, we used renice on one of the processes setting it to a value of 19. You can see the effect in the first image below as the blue process rarely runs in comparison to the yellow. In the second image we experimented with the effects of setting different nice values.
These visualizations are quite useful. They let us give someone an idea of what is running in their VM. While it can’t pinpoint it to the exact process, it does let the user understand what the characteristics of their workload are and whether it is a few long lived processes fighting for the CPU, lots of short lived processes coming and going, or something in between. Like the rest of these metrics this lets you understand where in your fleet of VMs the problem may be occurring and help narrow things down to which few VMs should be looked at with native tools.
Conclusion
We’ve only begun to scratch the surface of what we can understand about a virtual machine running under KVM on illumos. Needless to say, this wouldn’t be possible without DTrace and its guarantees of safety for use on production systems and only the overhead of a few NOPs when not in use. As time goes on we’ll be experimenting on what information can help us, operators, and end users better understand their VM’s performance and adding those abilities to Cloud Analytics.